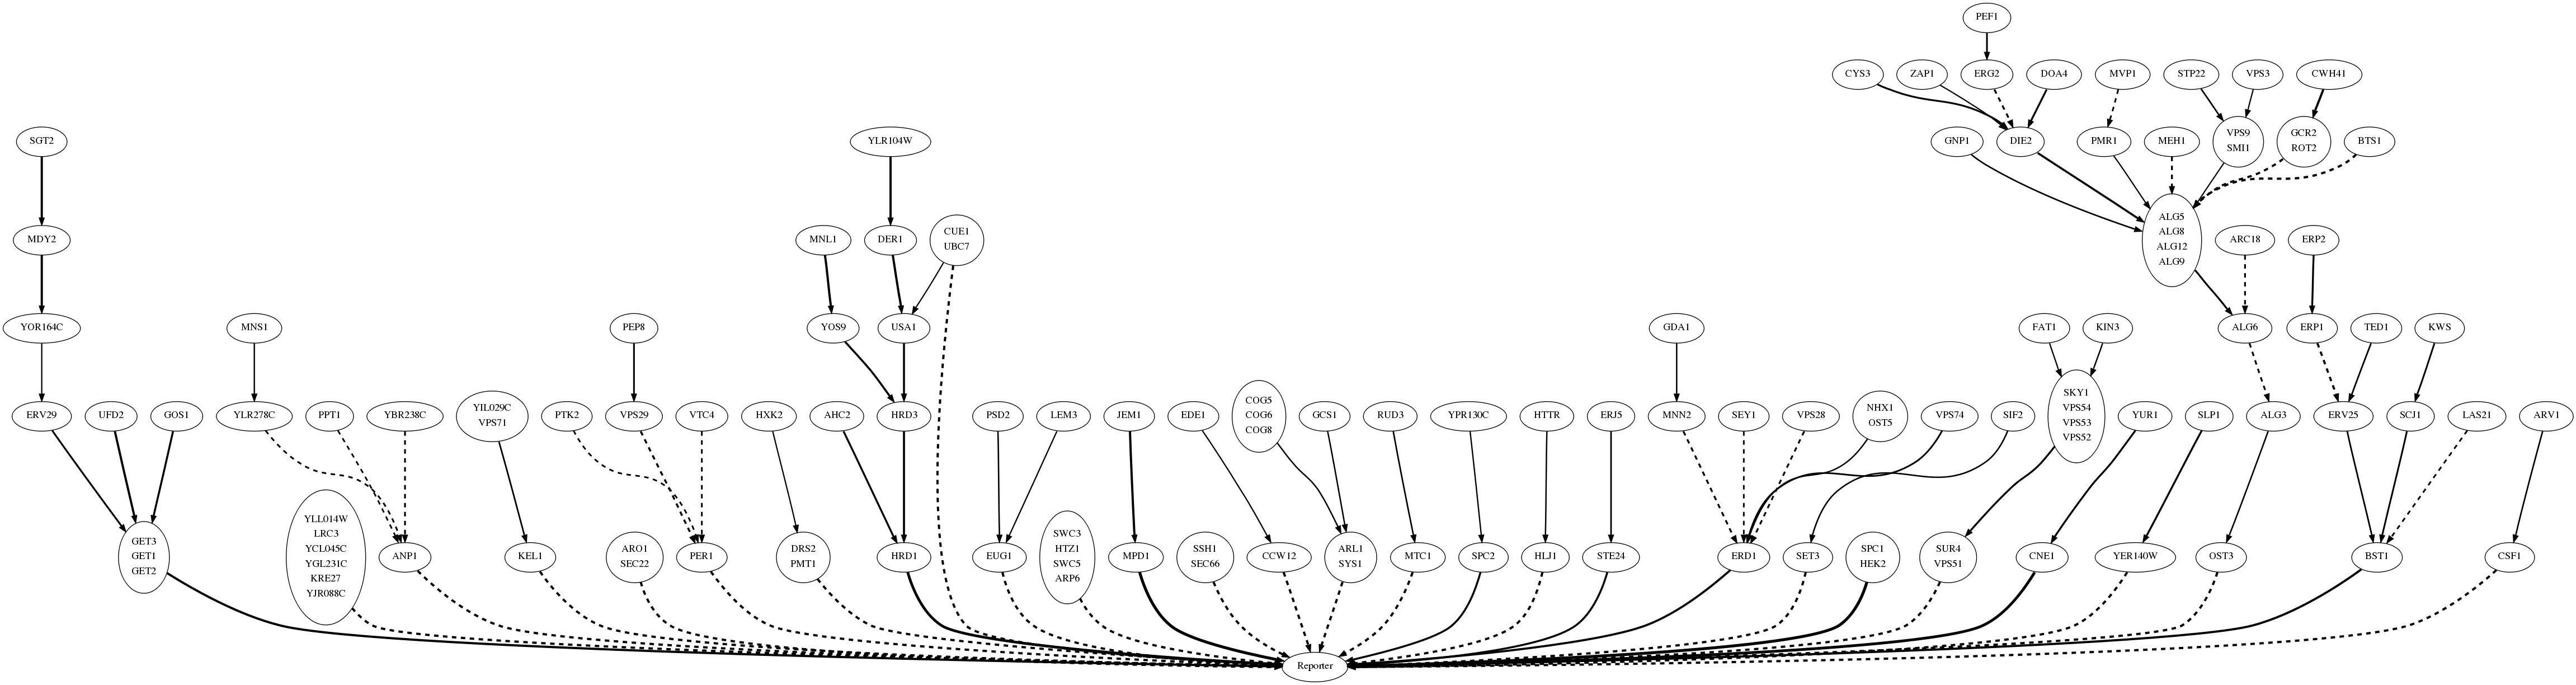
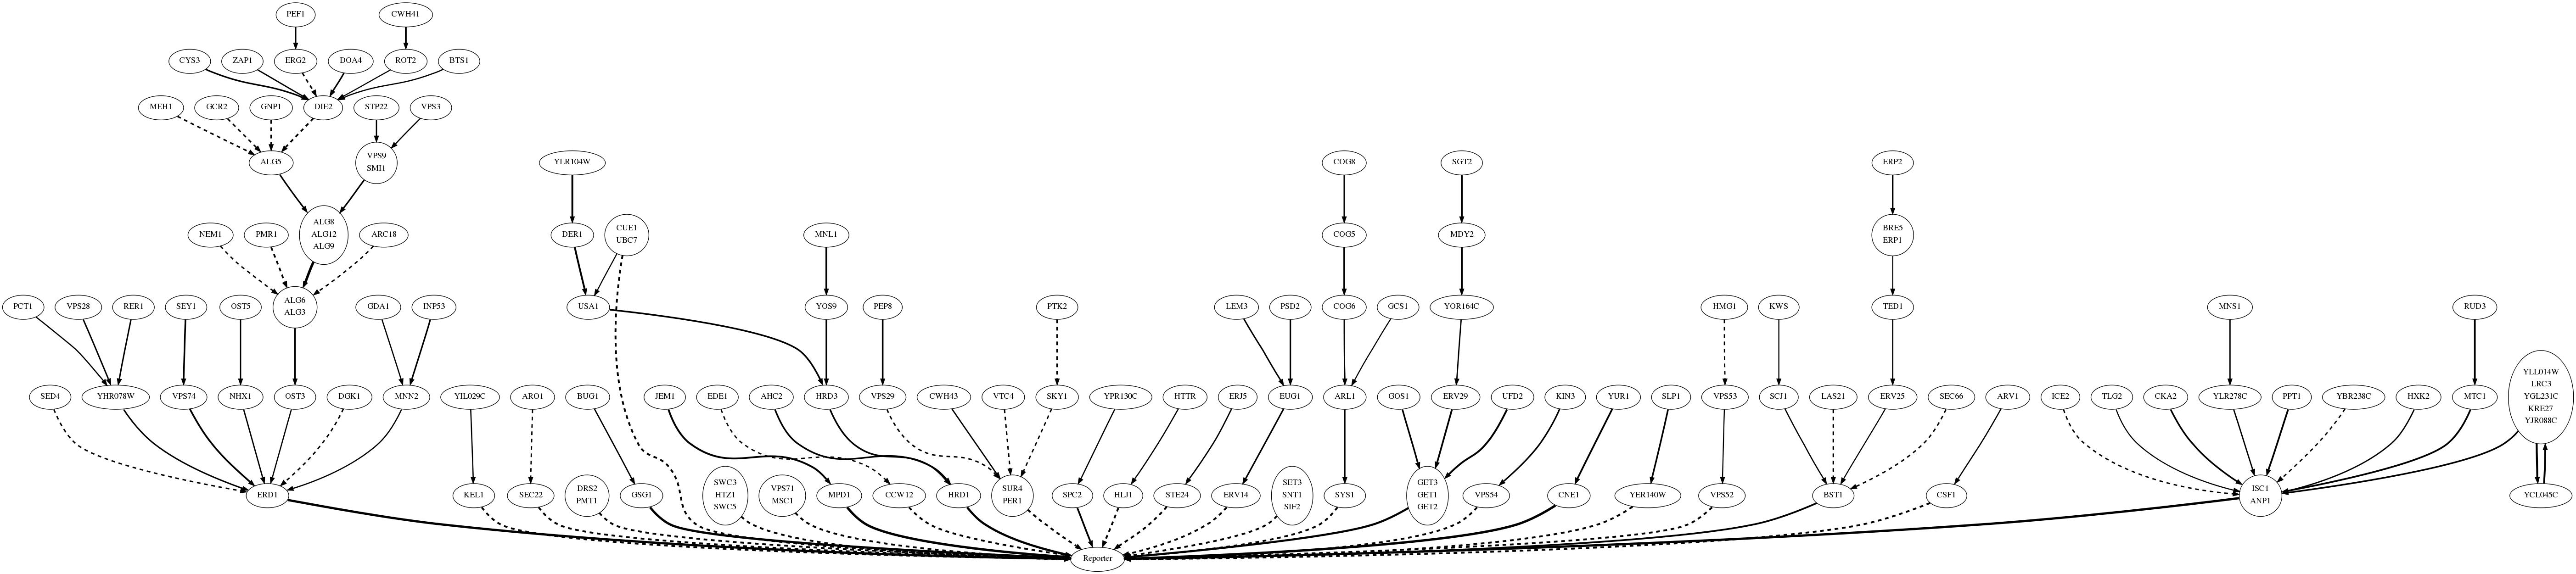
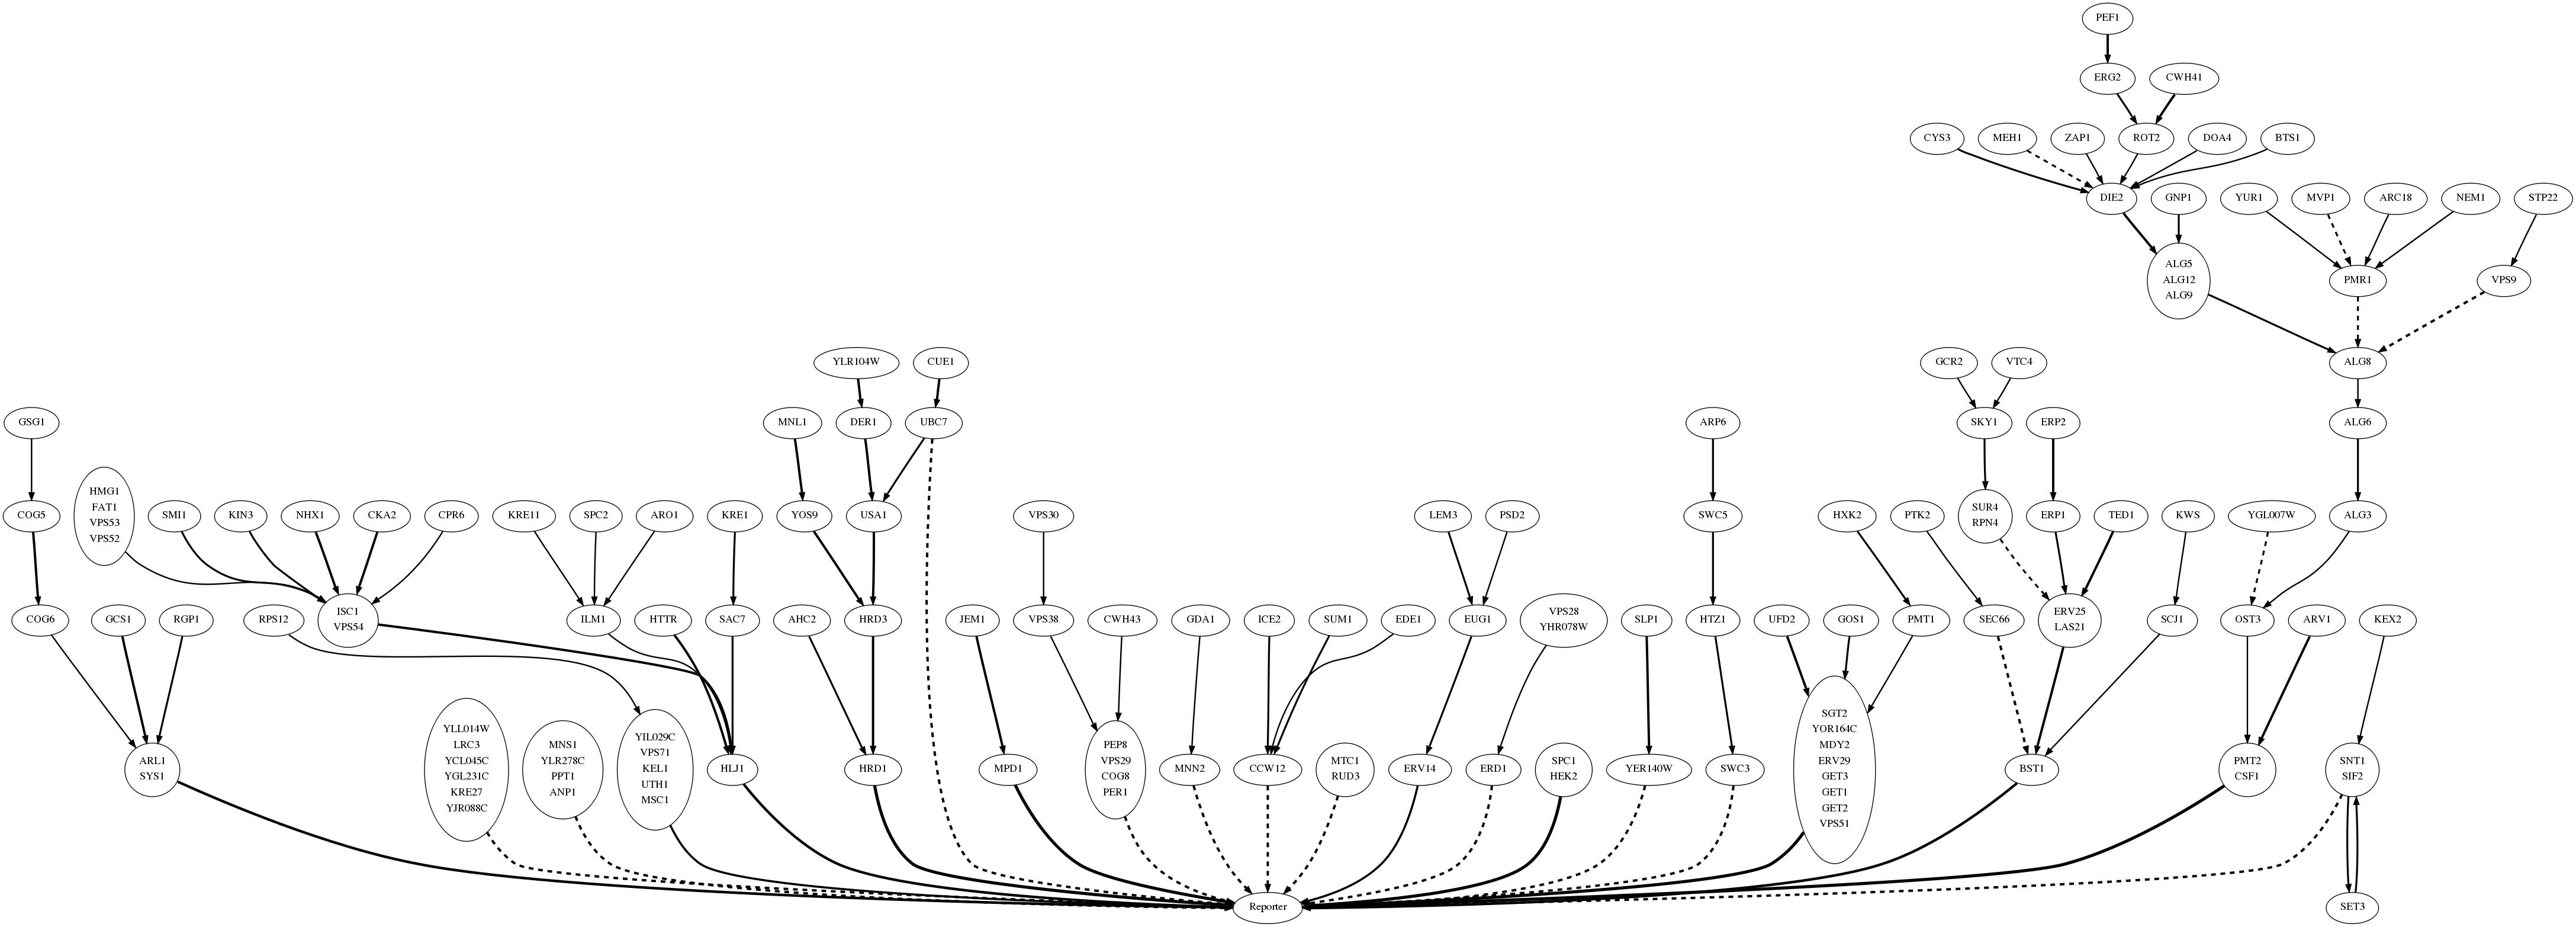
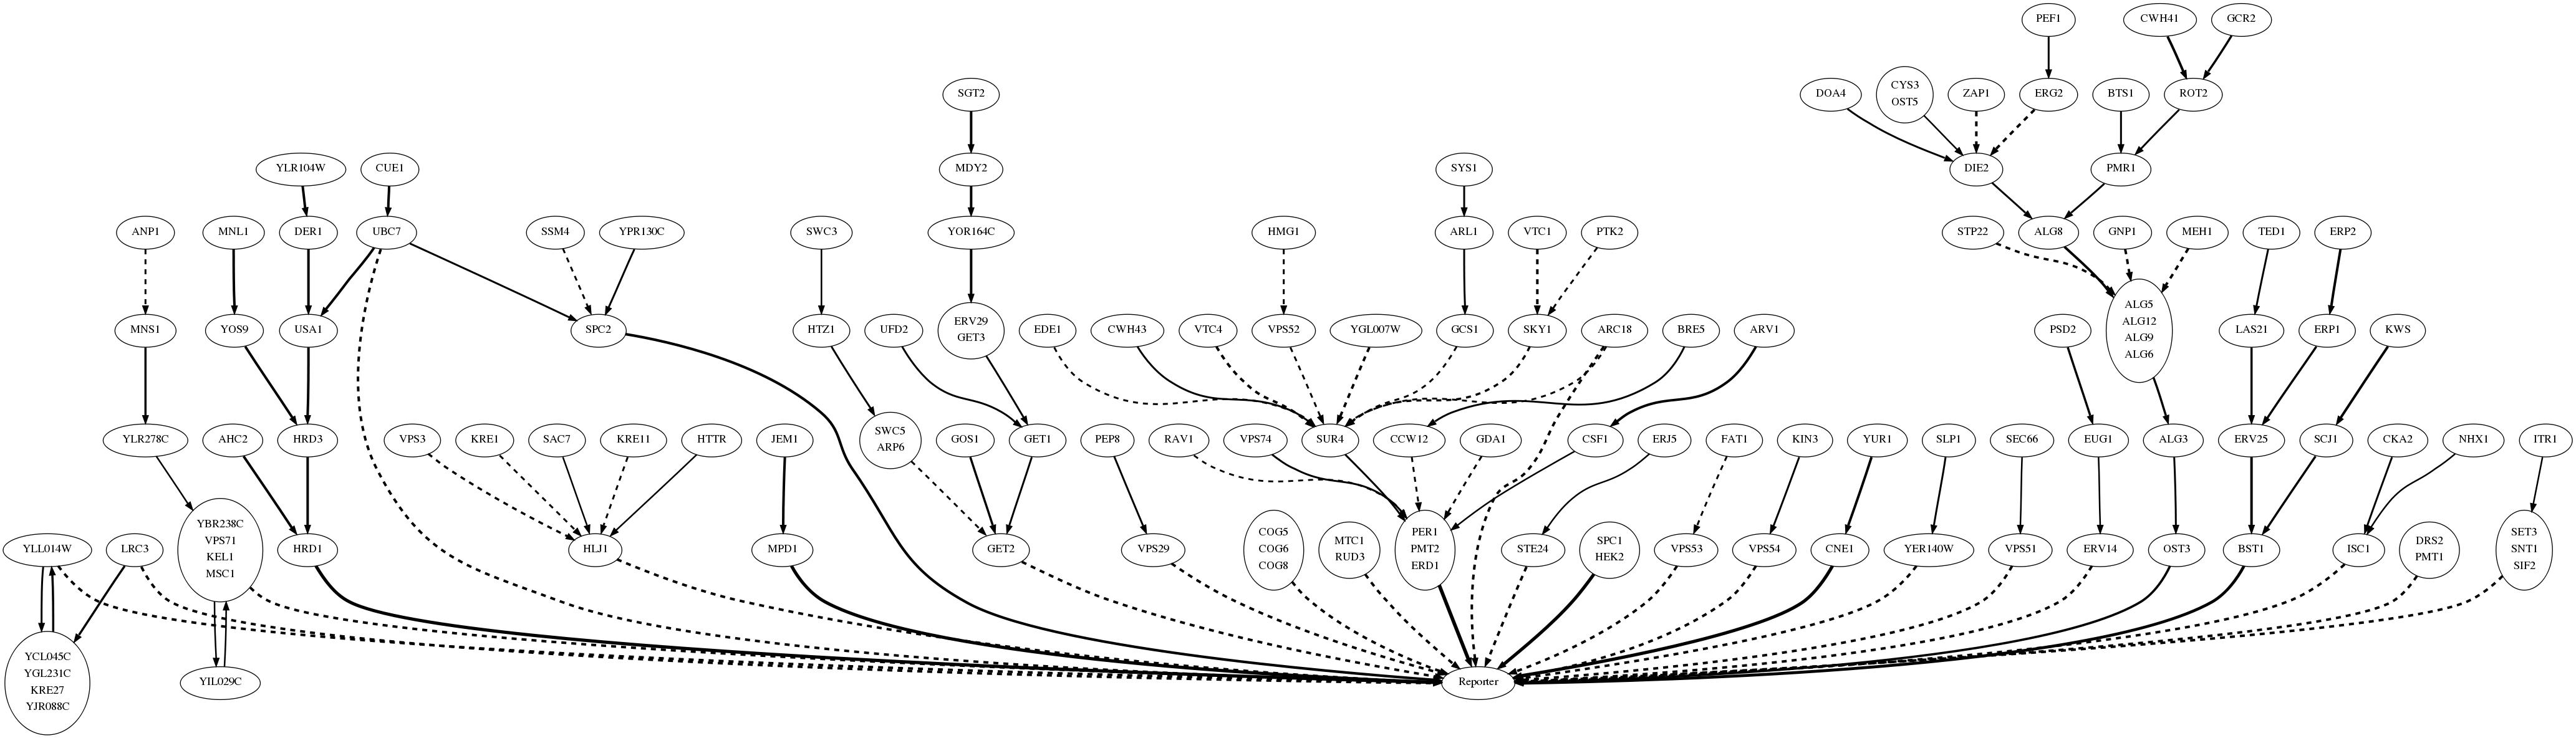
Activity Pathway Networks
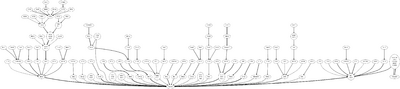
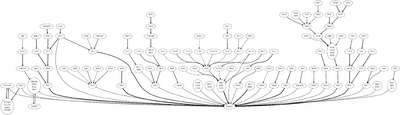
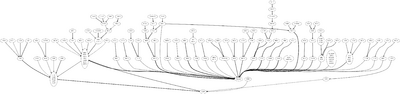
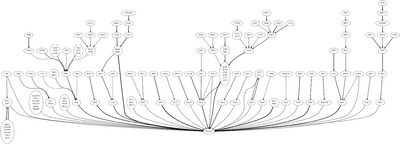
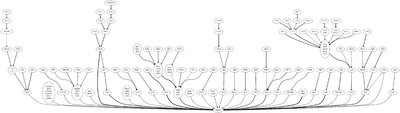
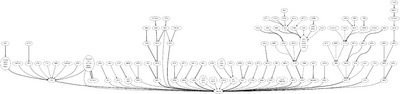
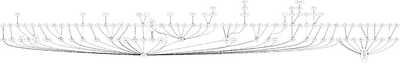
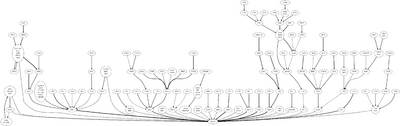
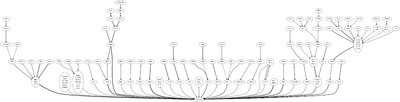
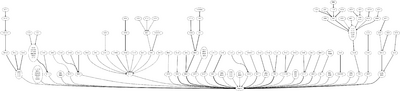
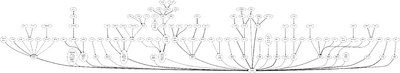
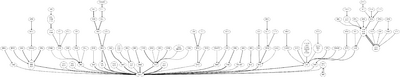
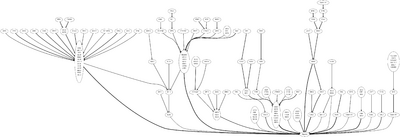
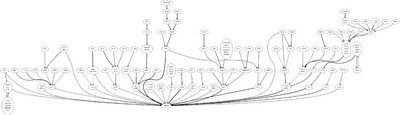
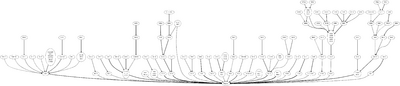
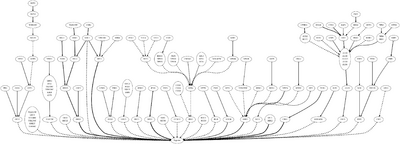
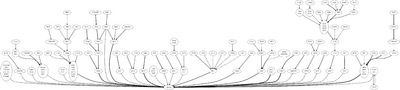
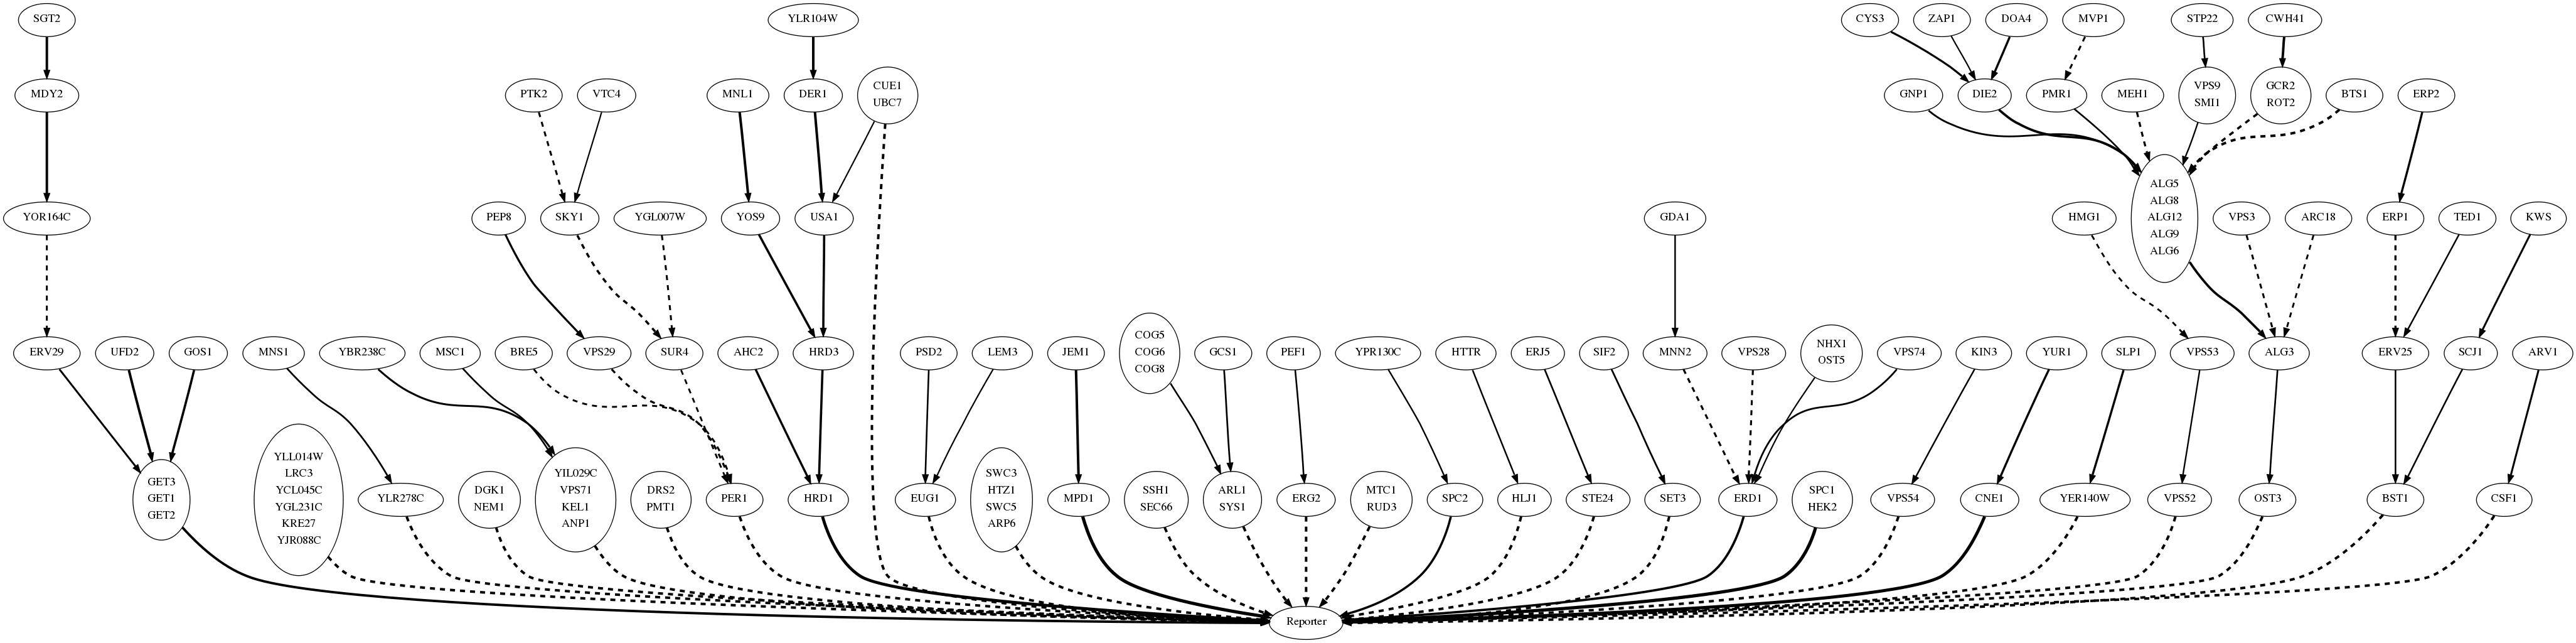
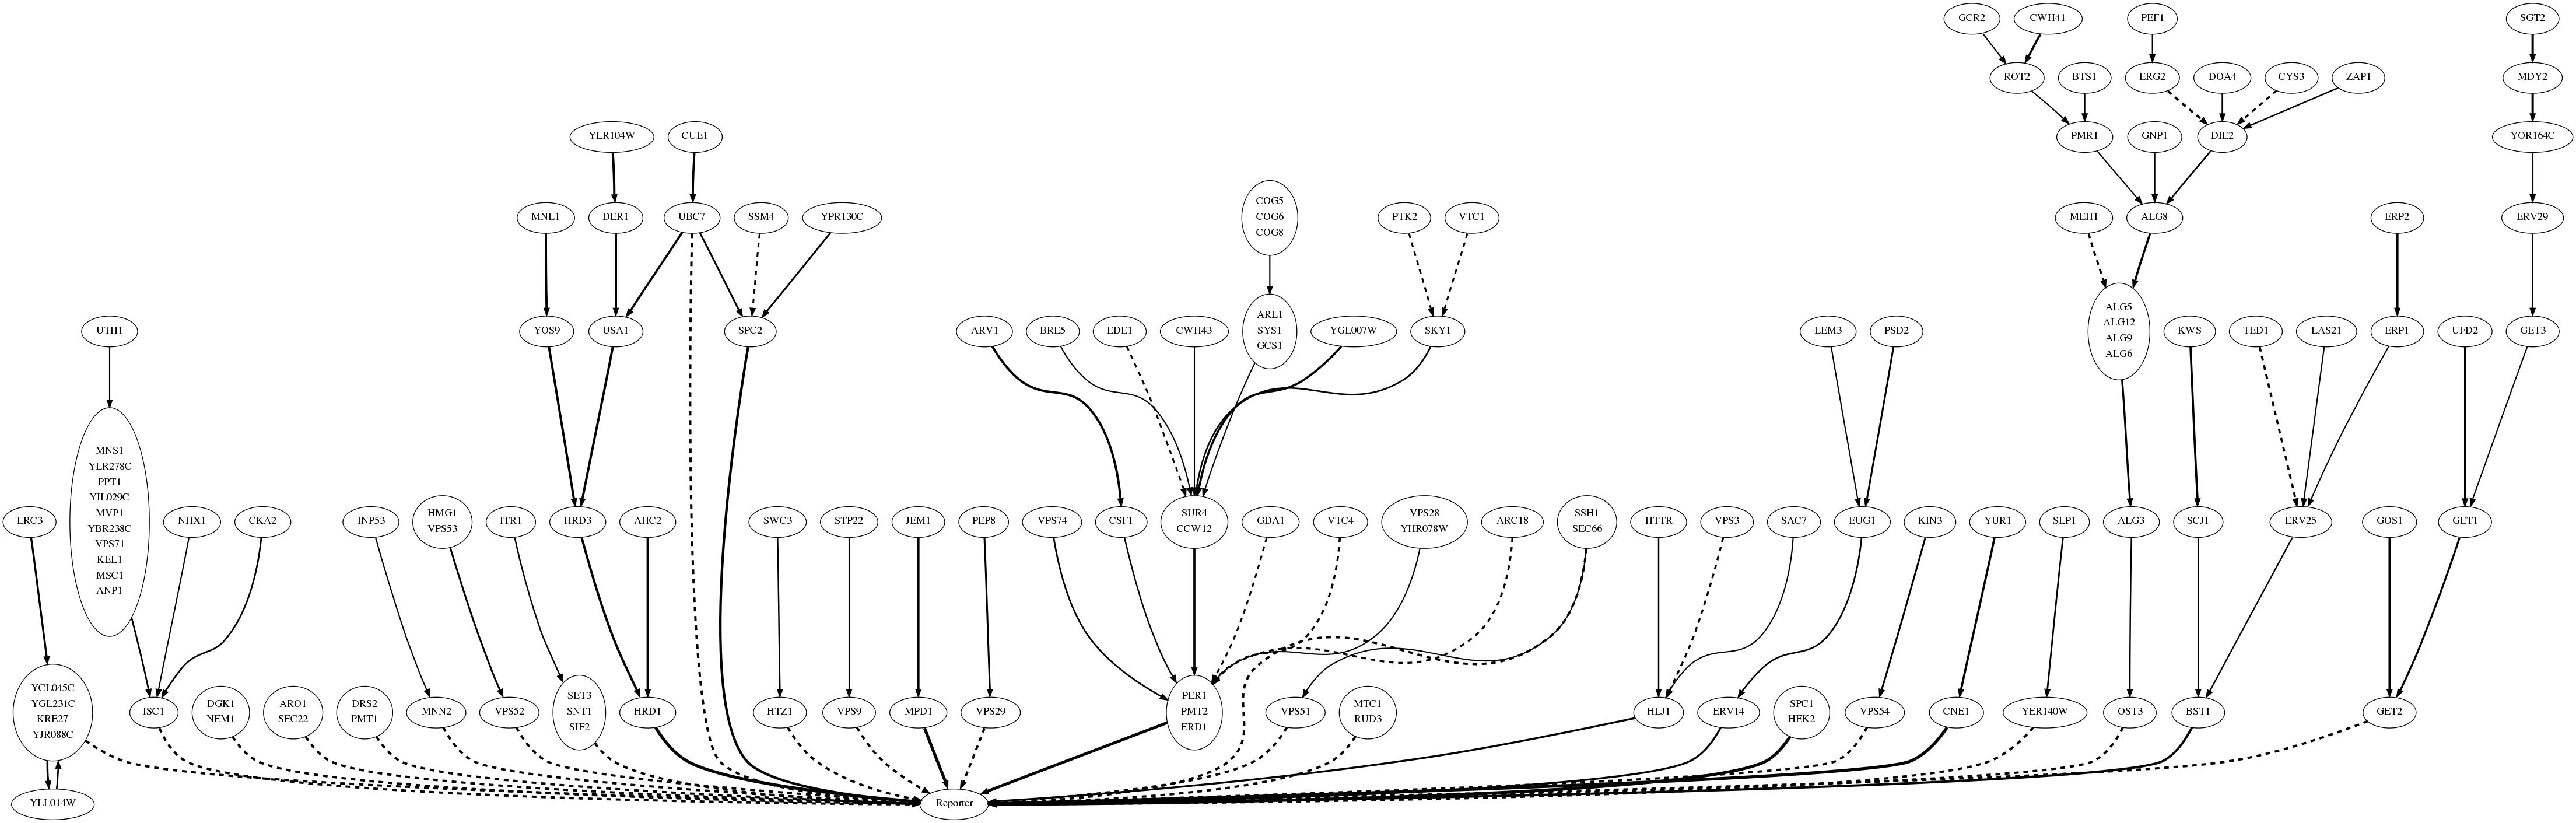
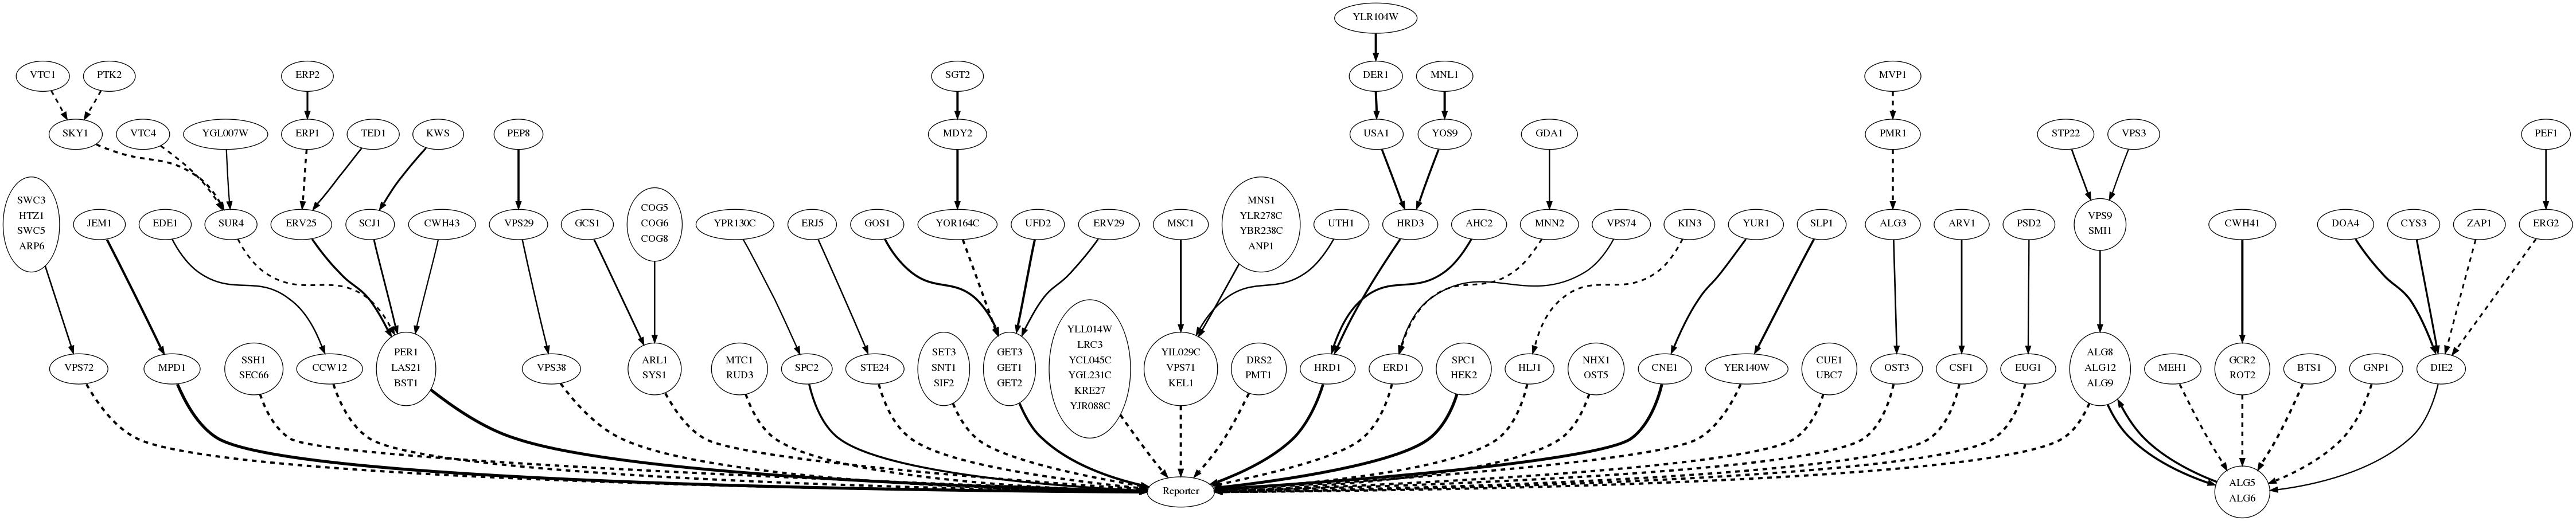
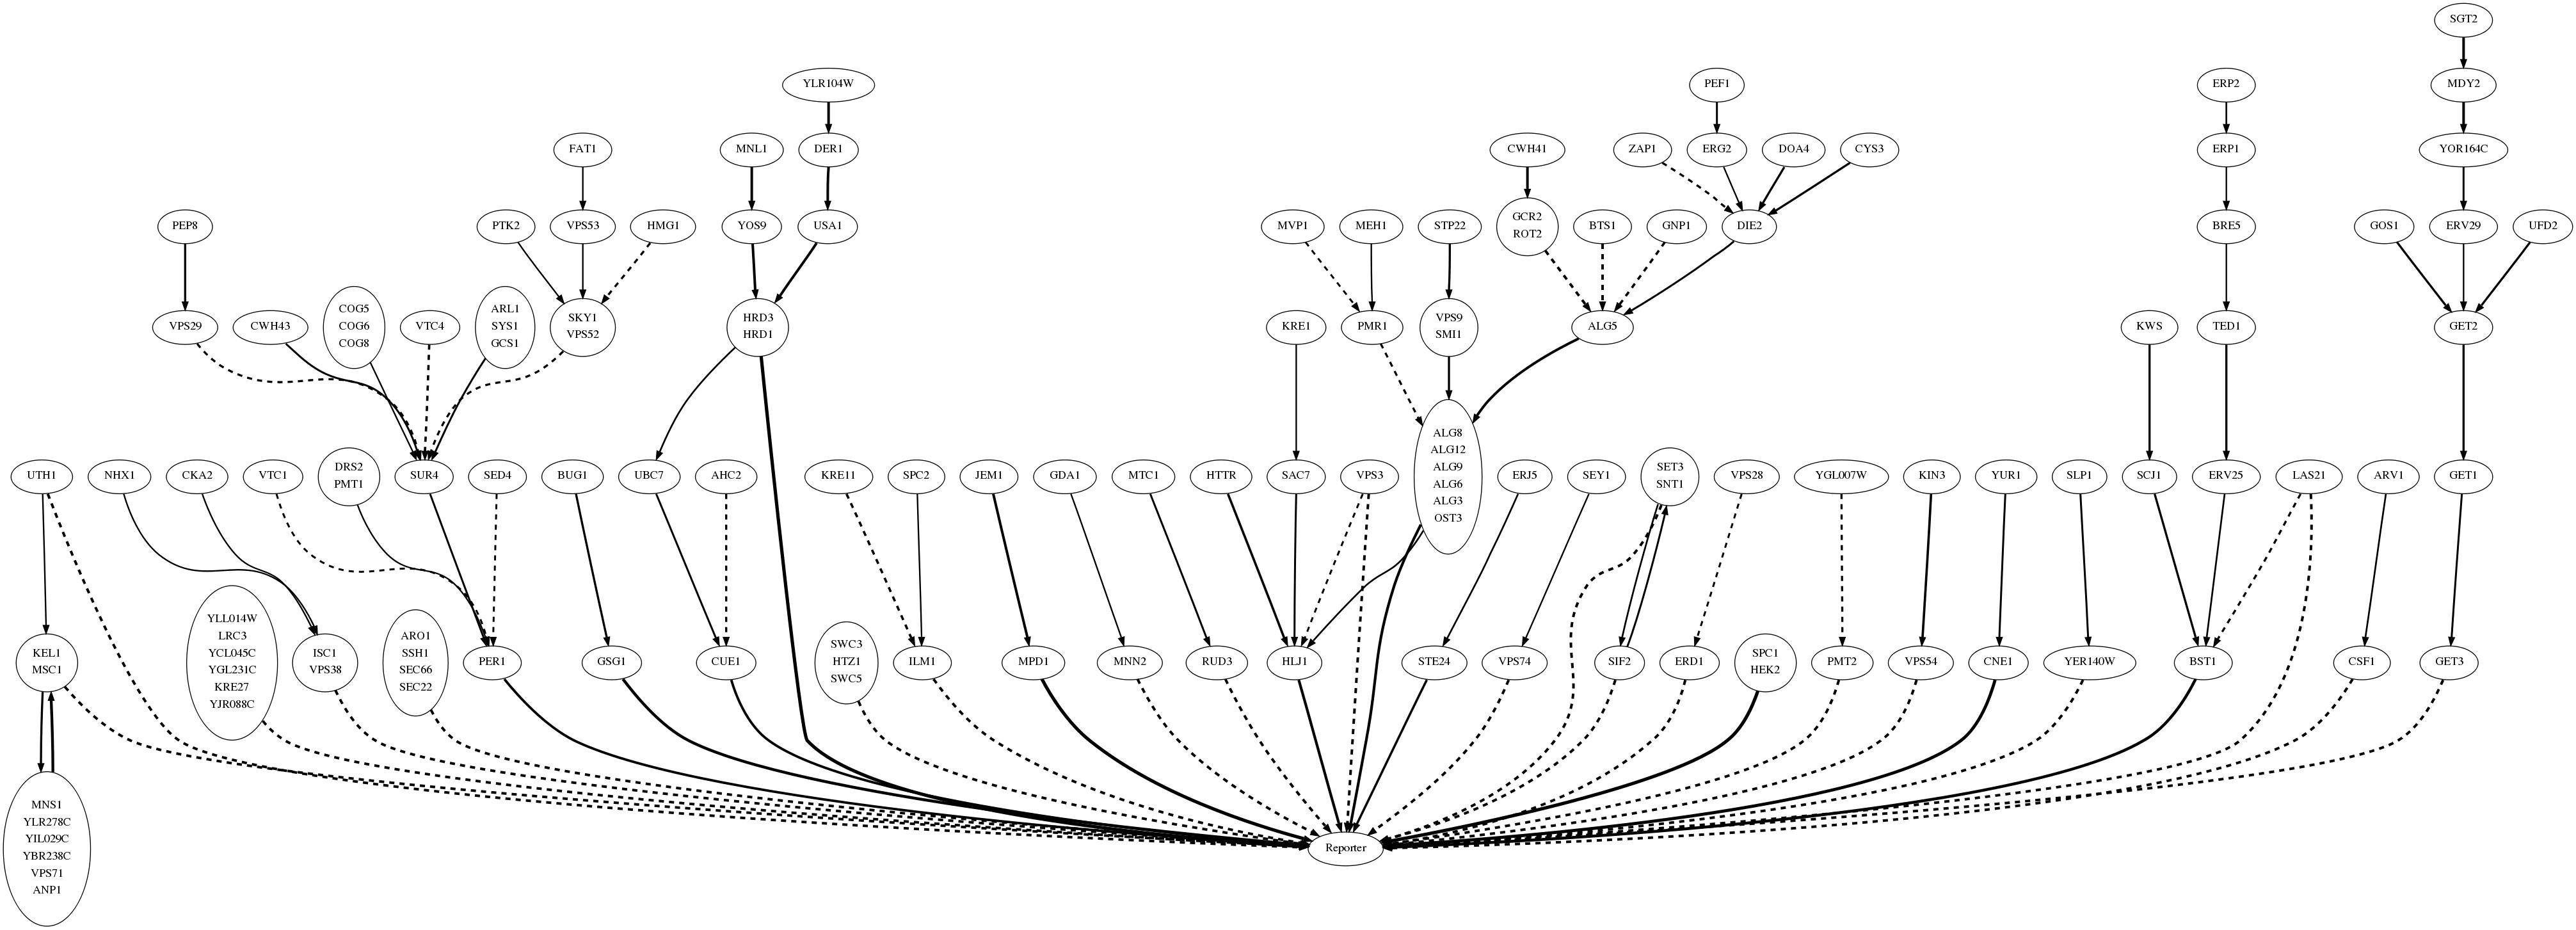
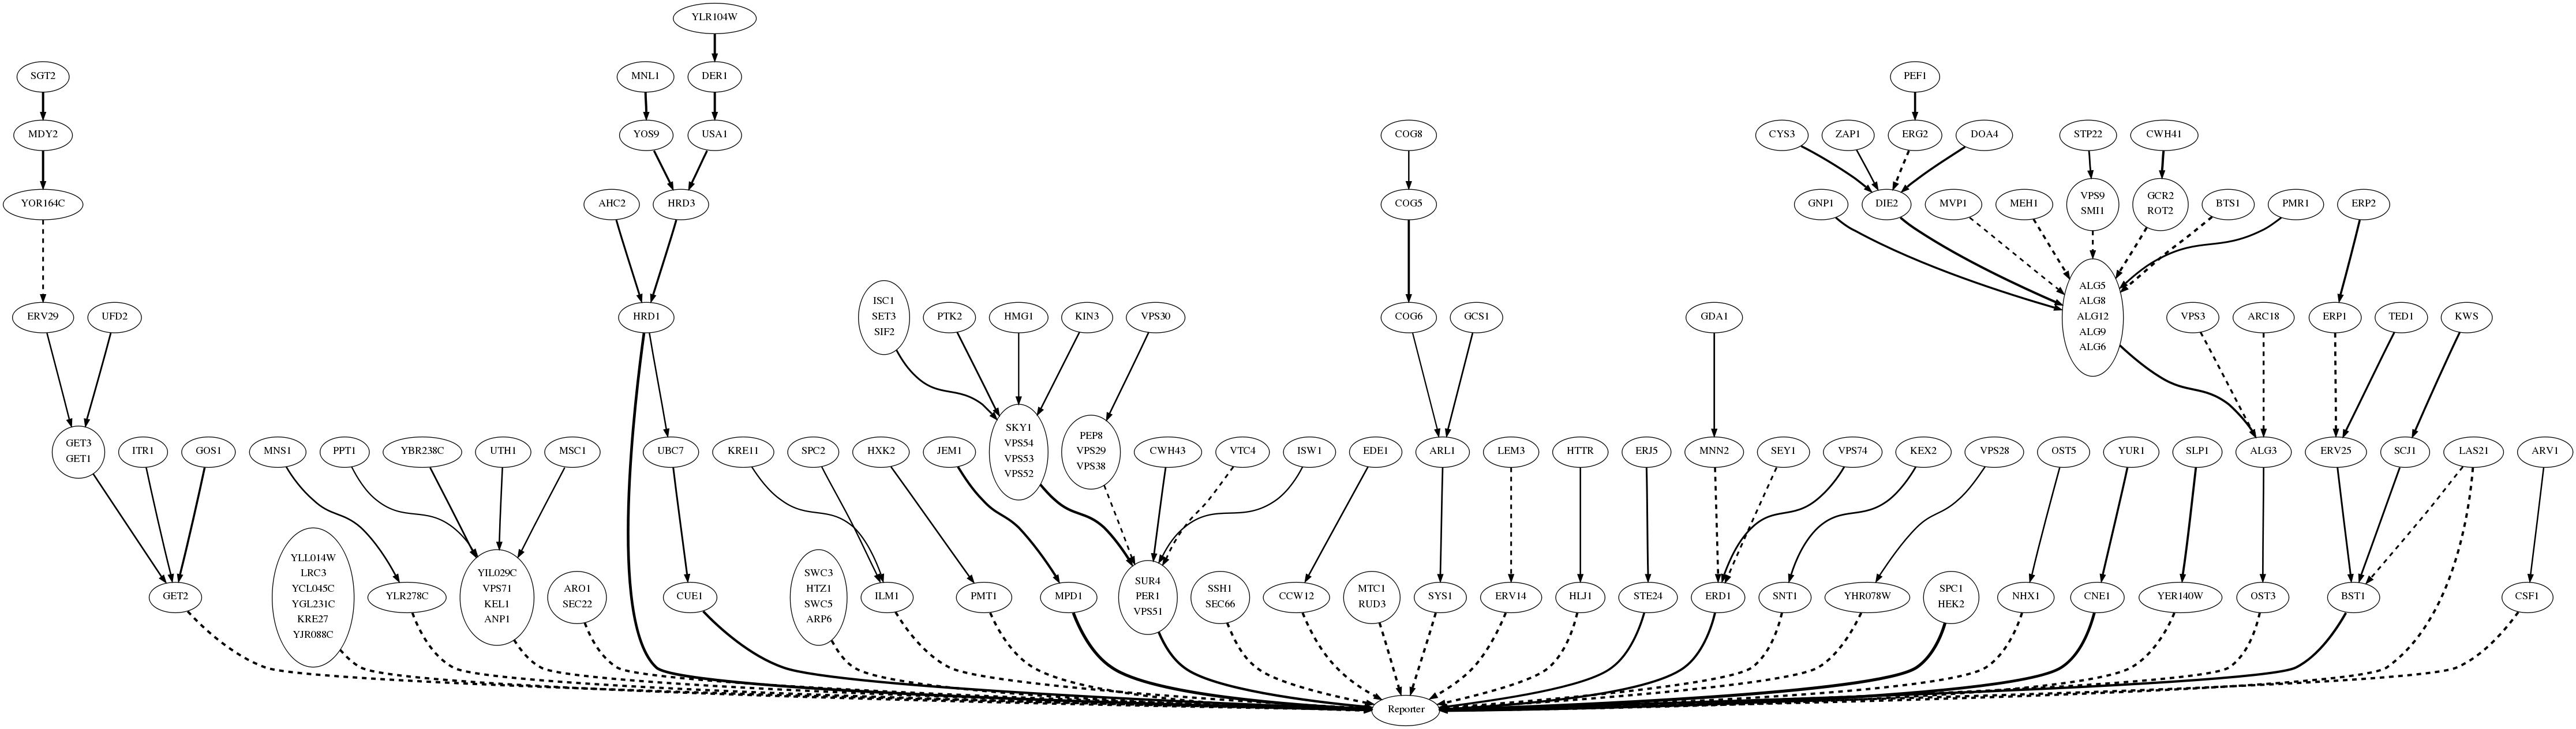
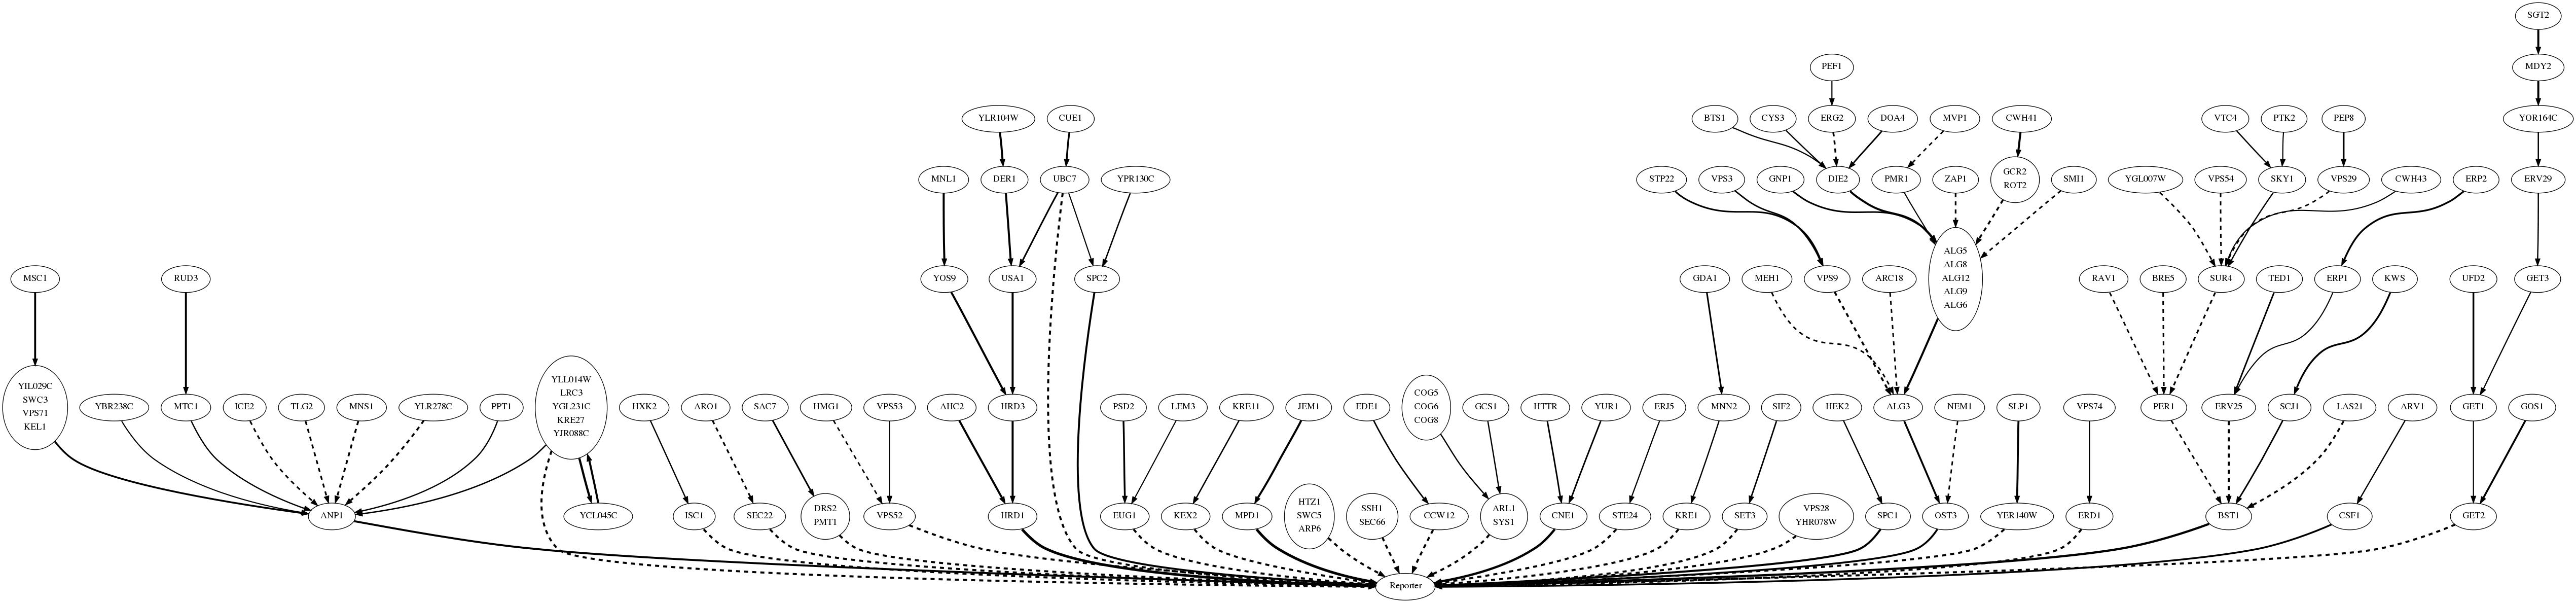
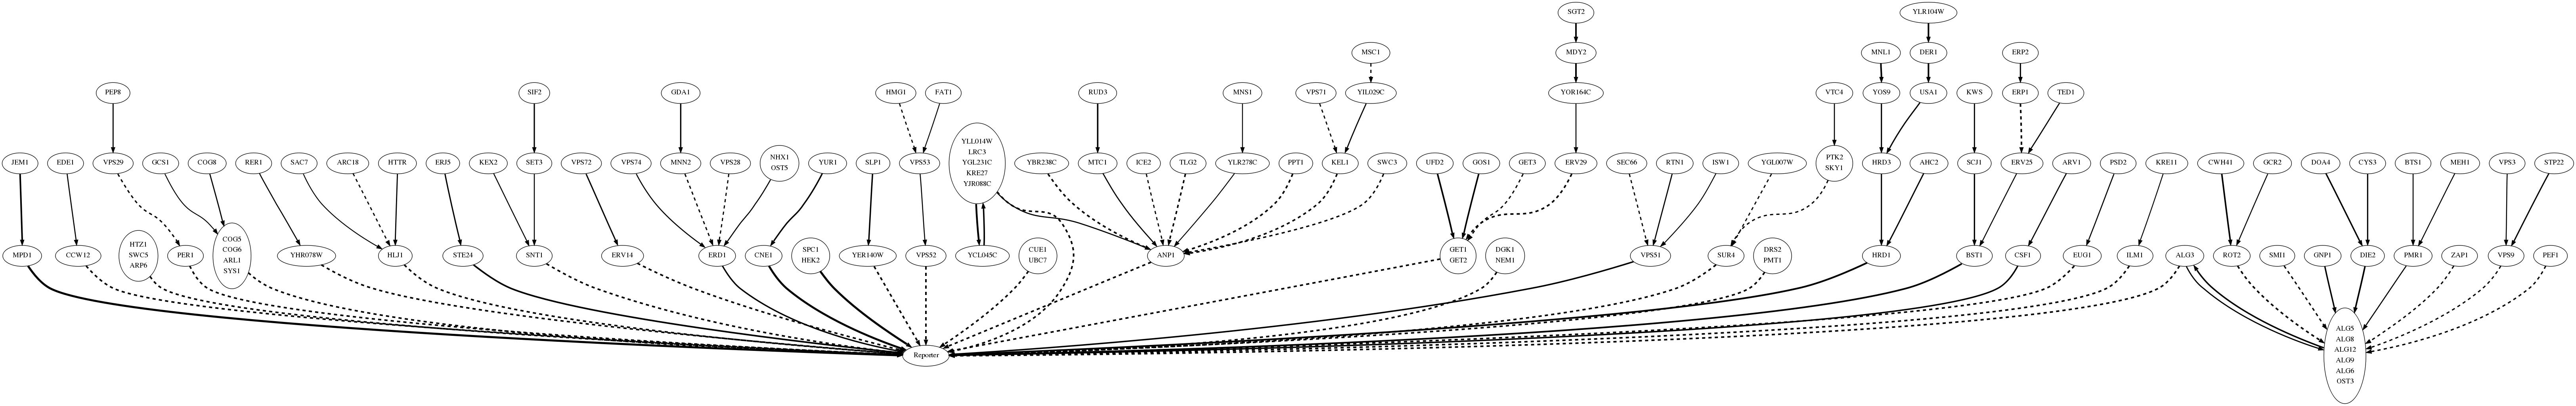
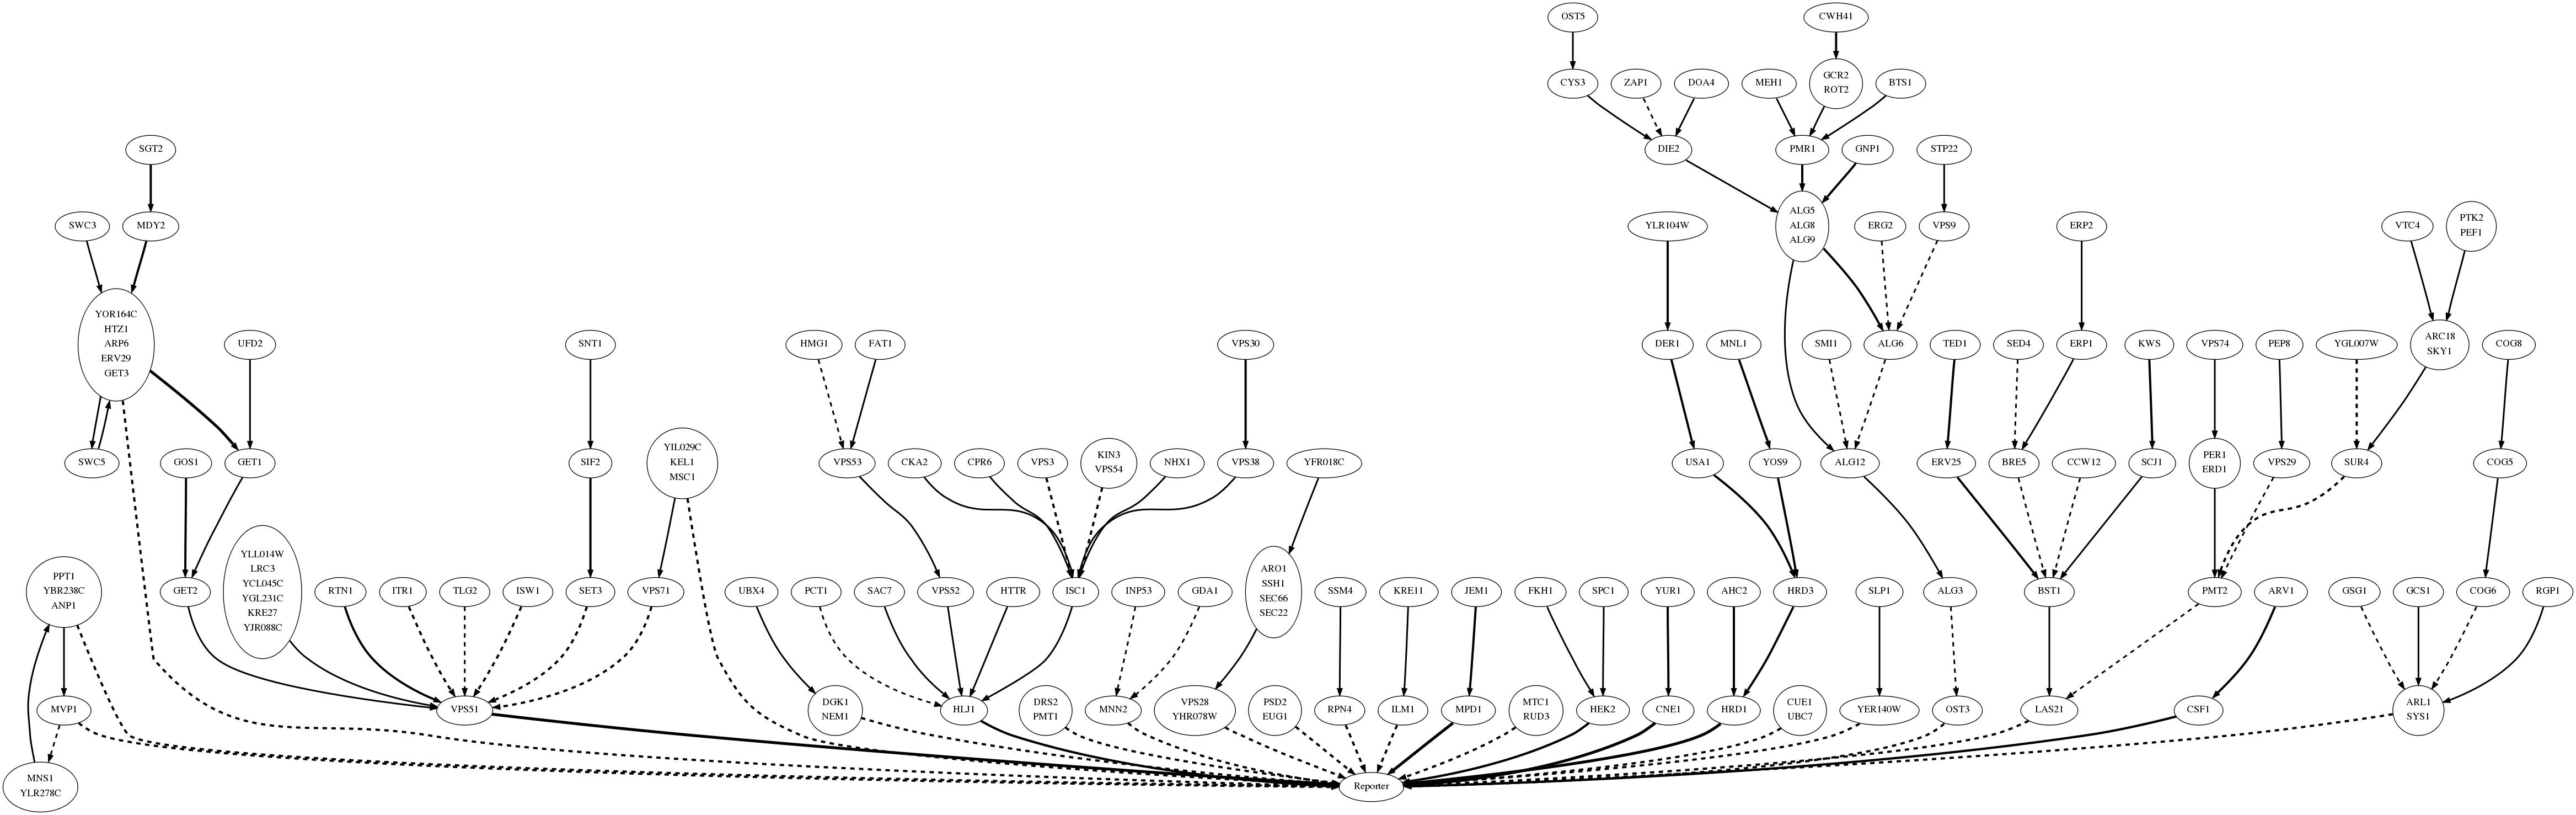
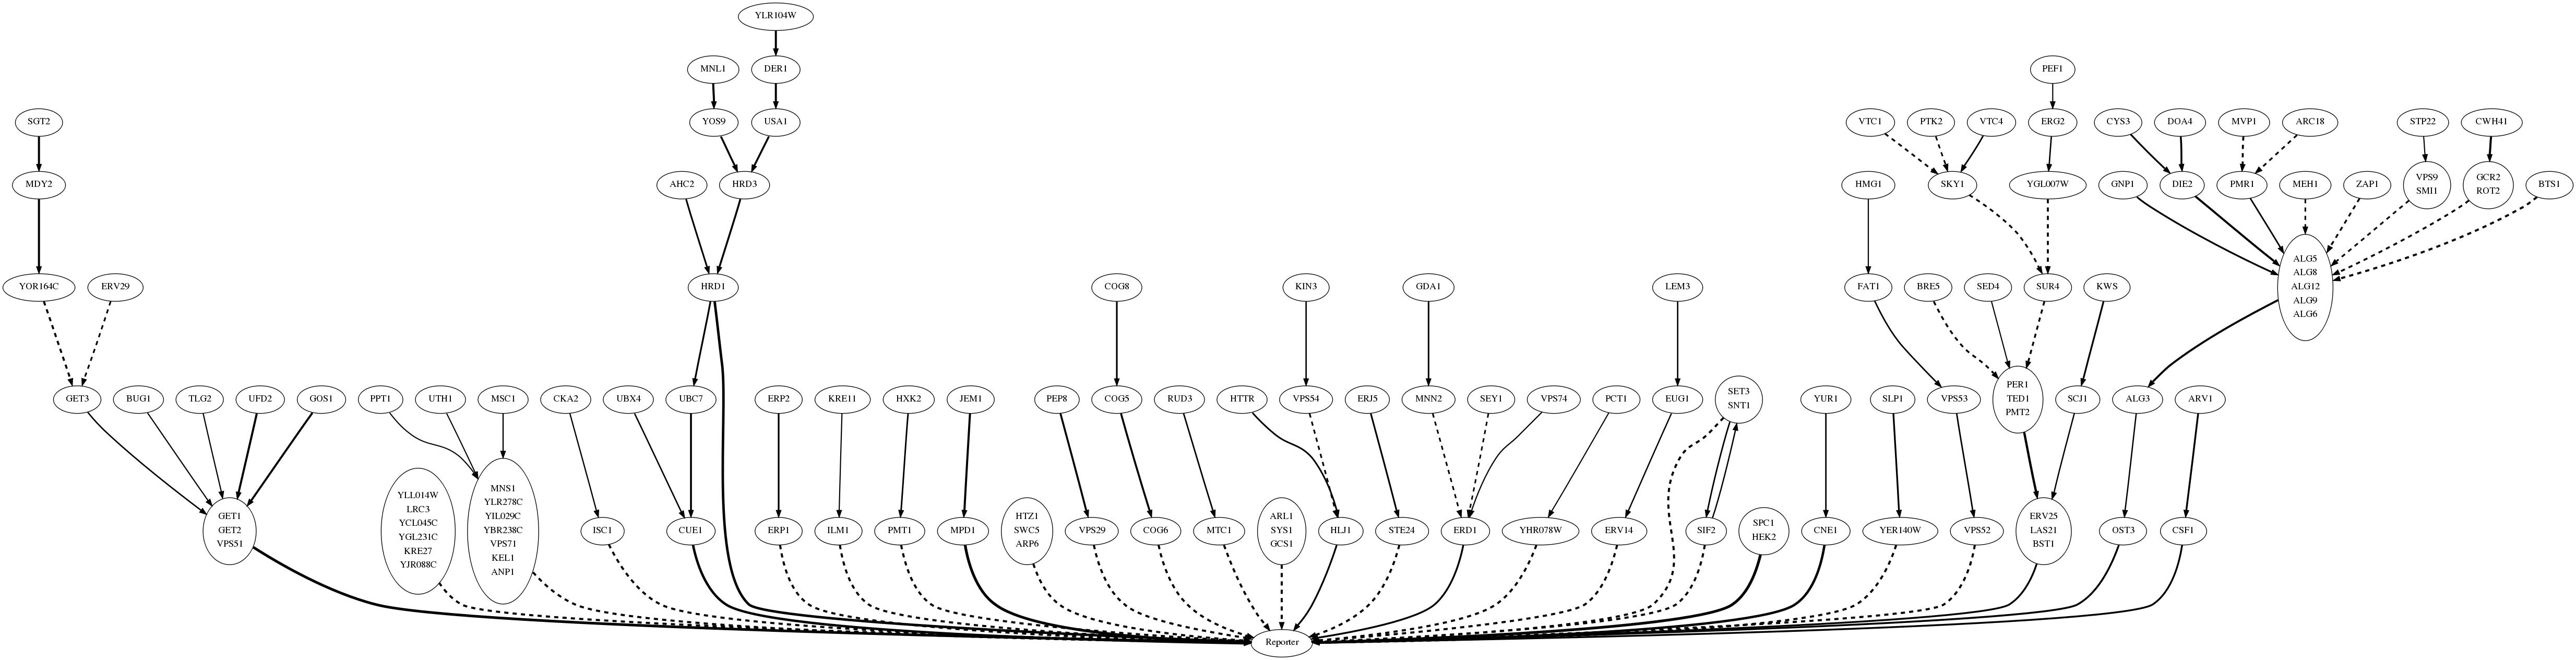
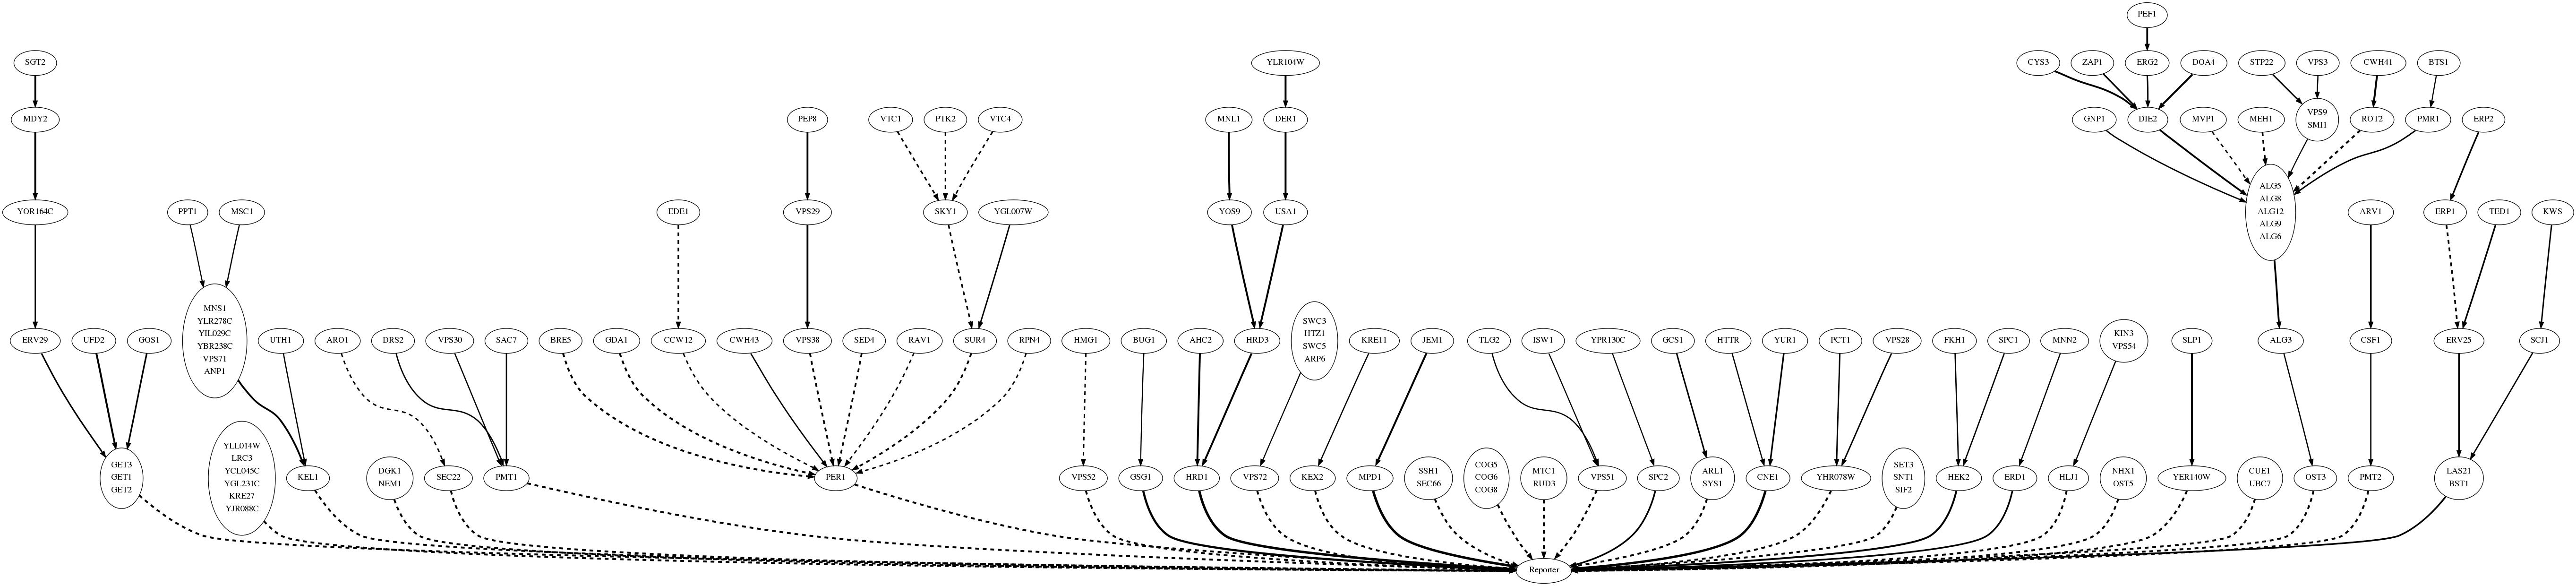
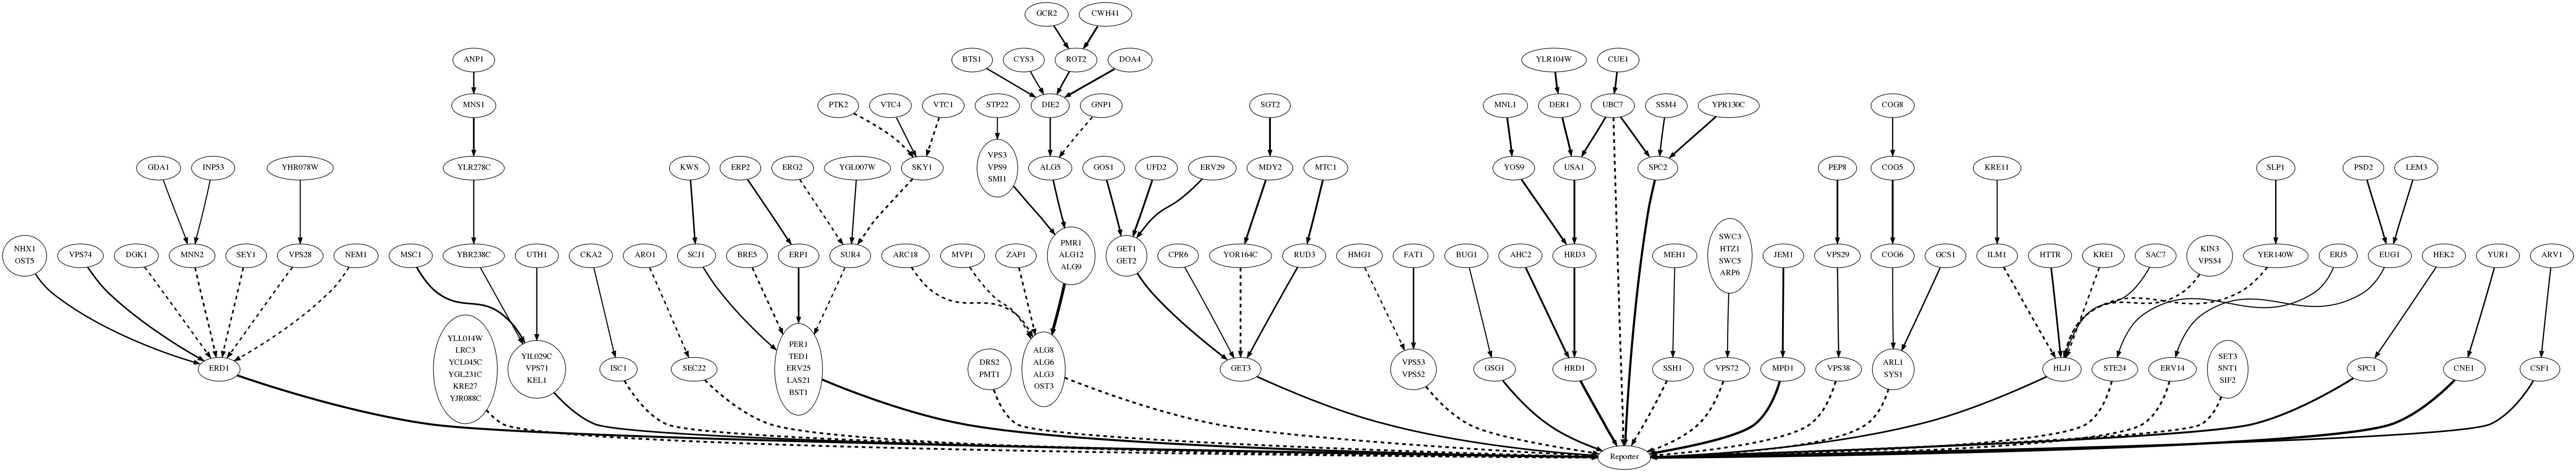
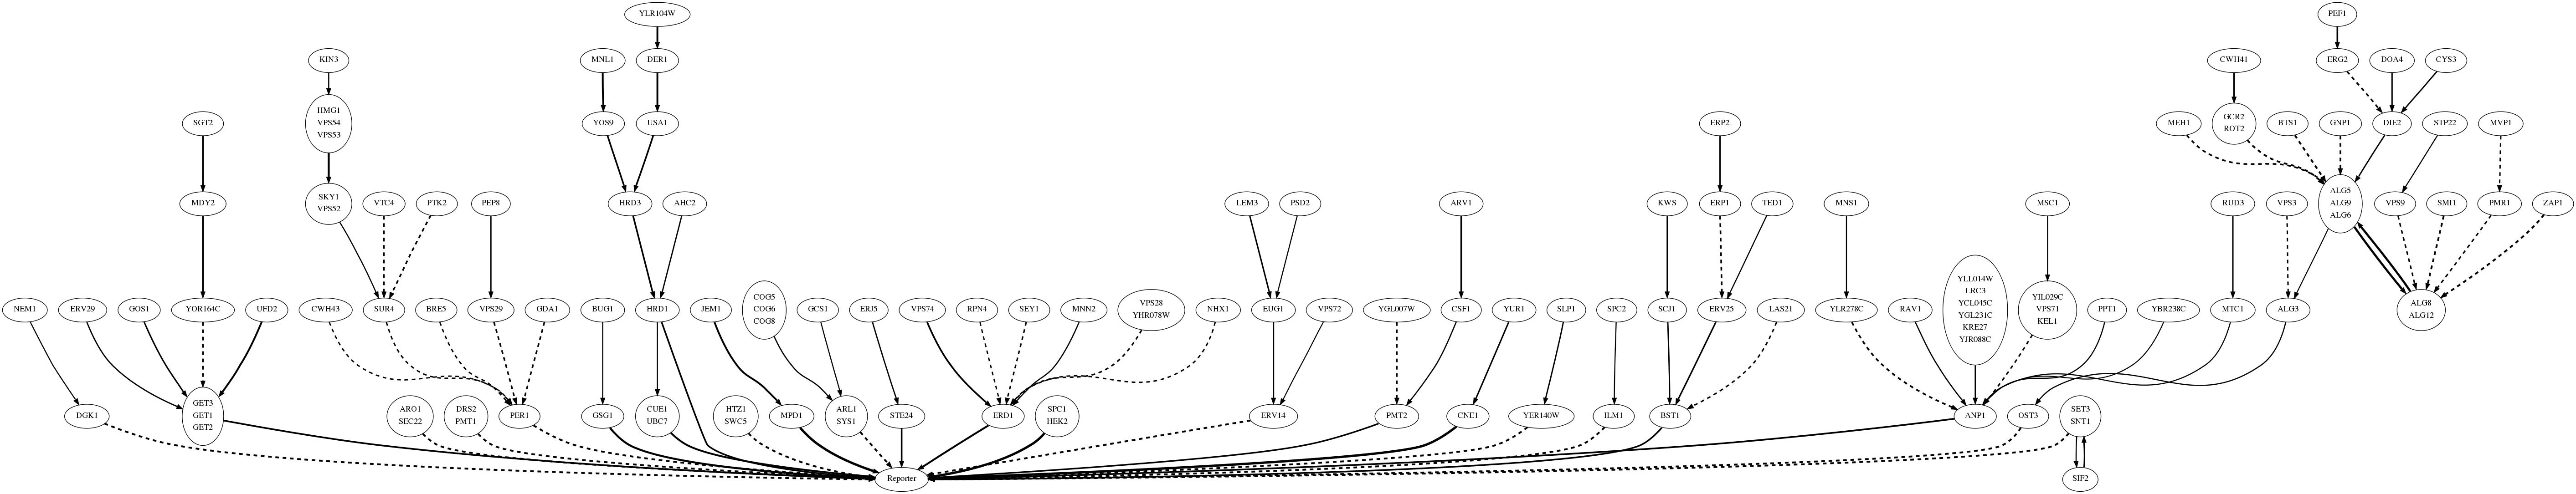
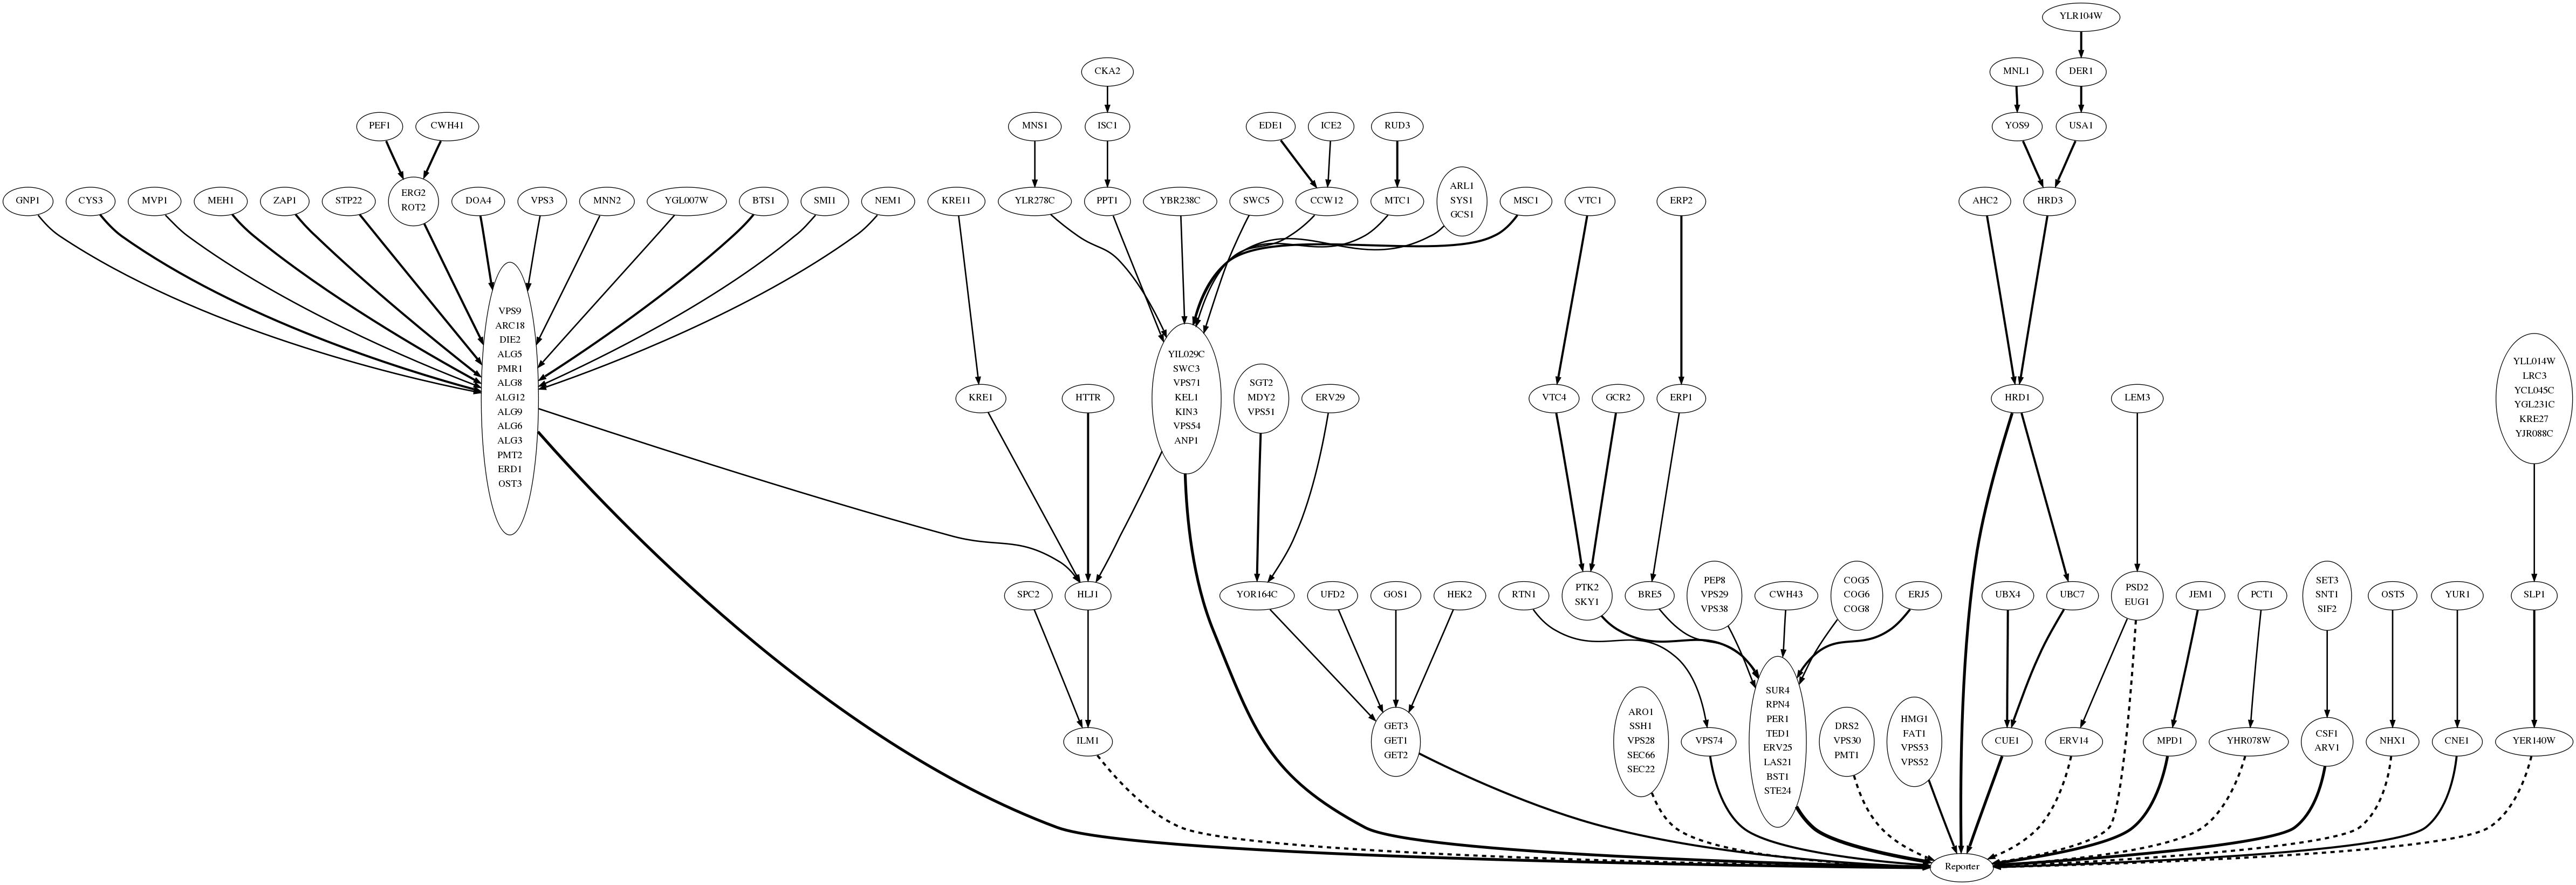
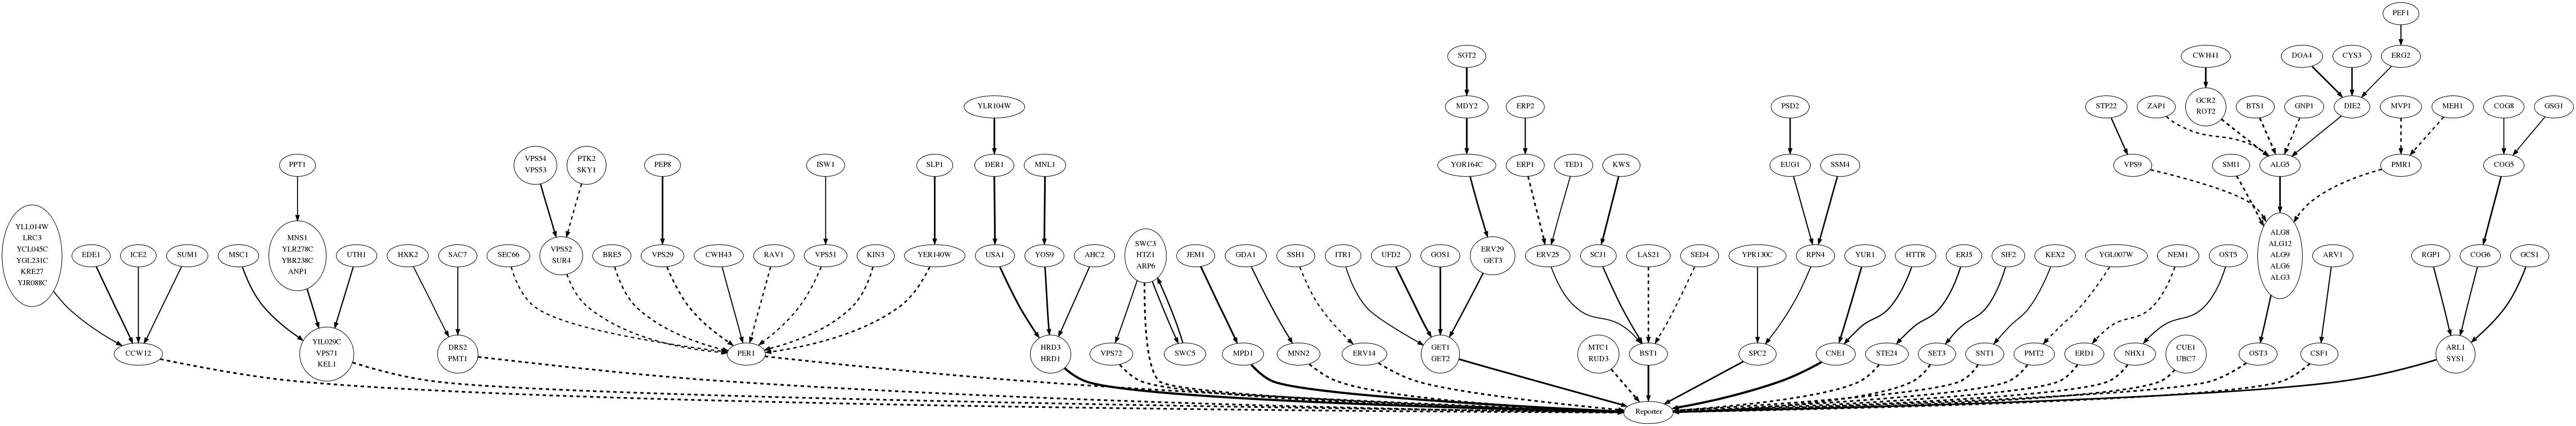
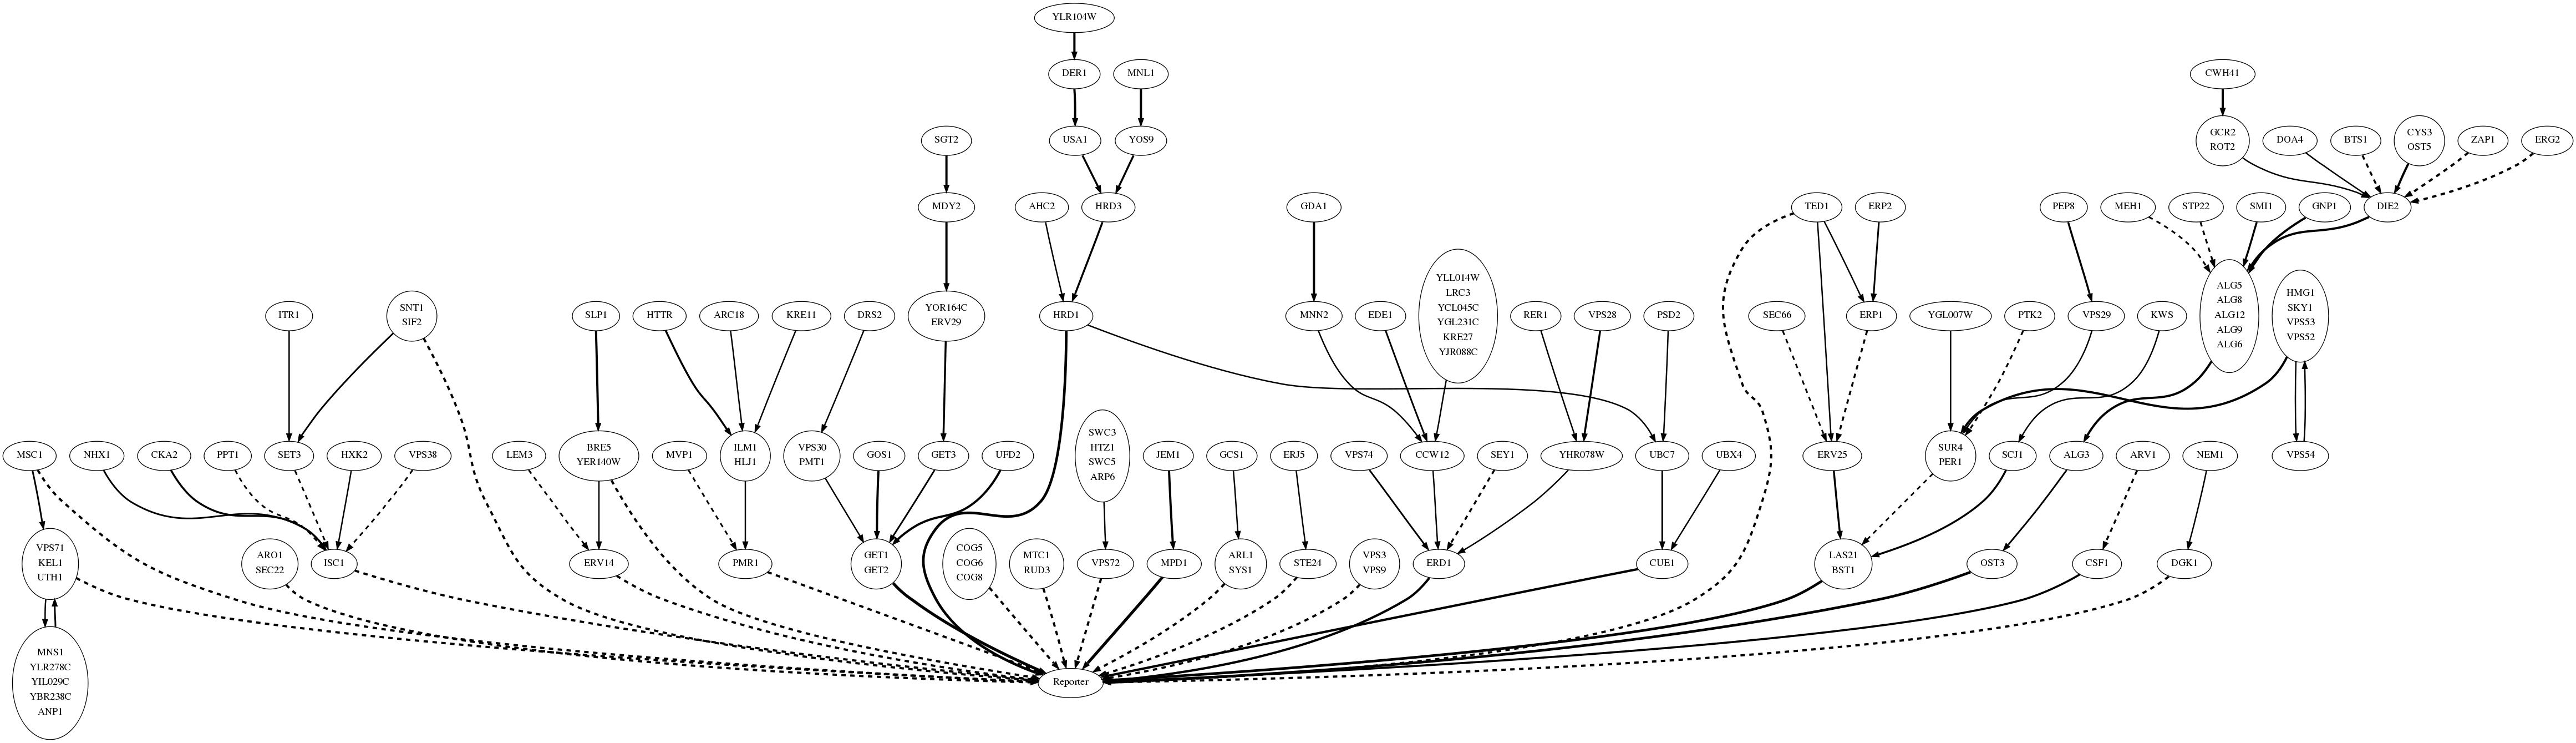
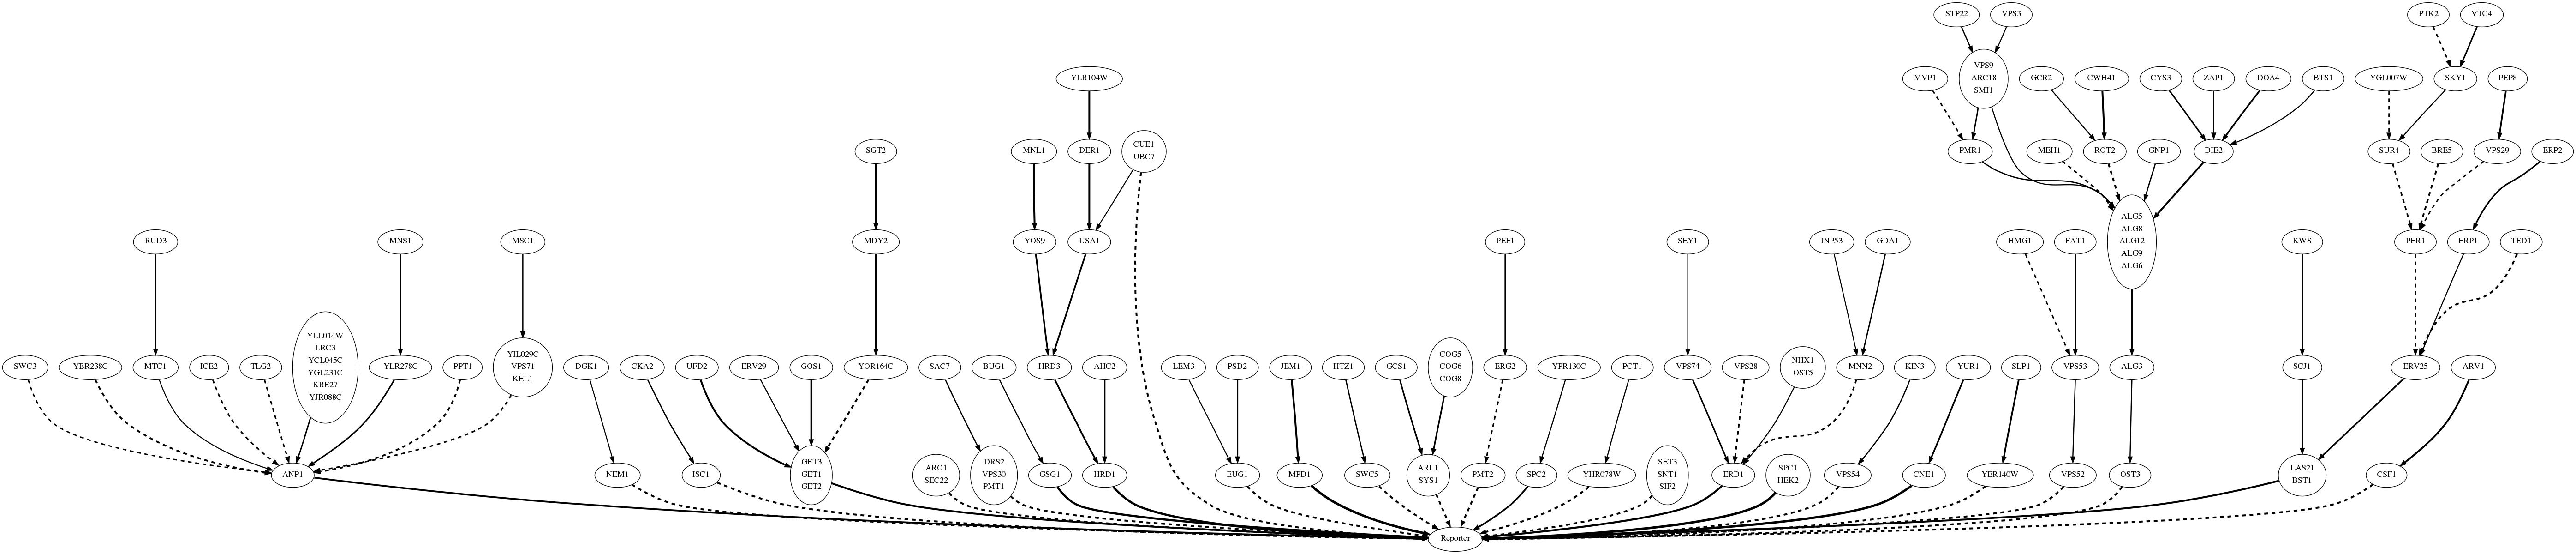
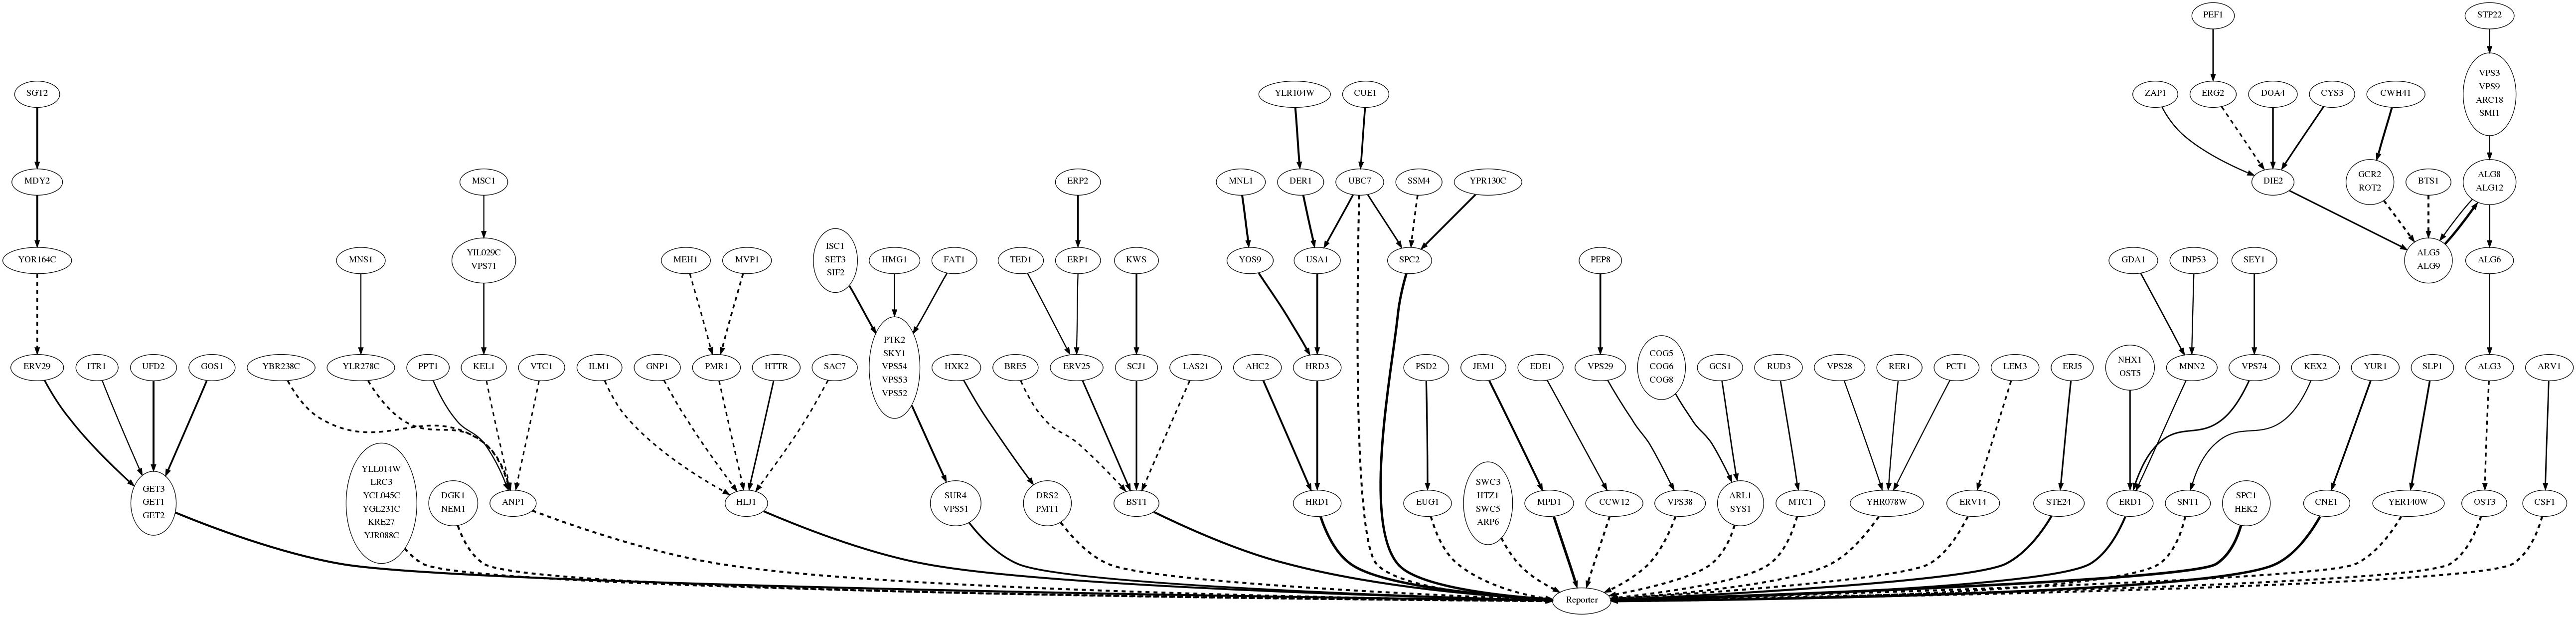
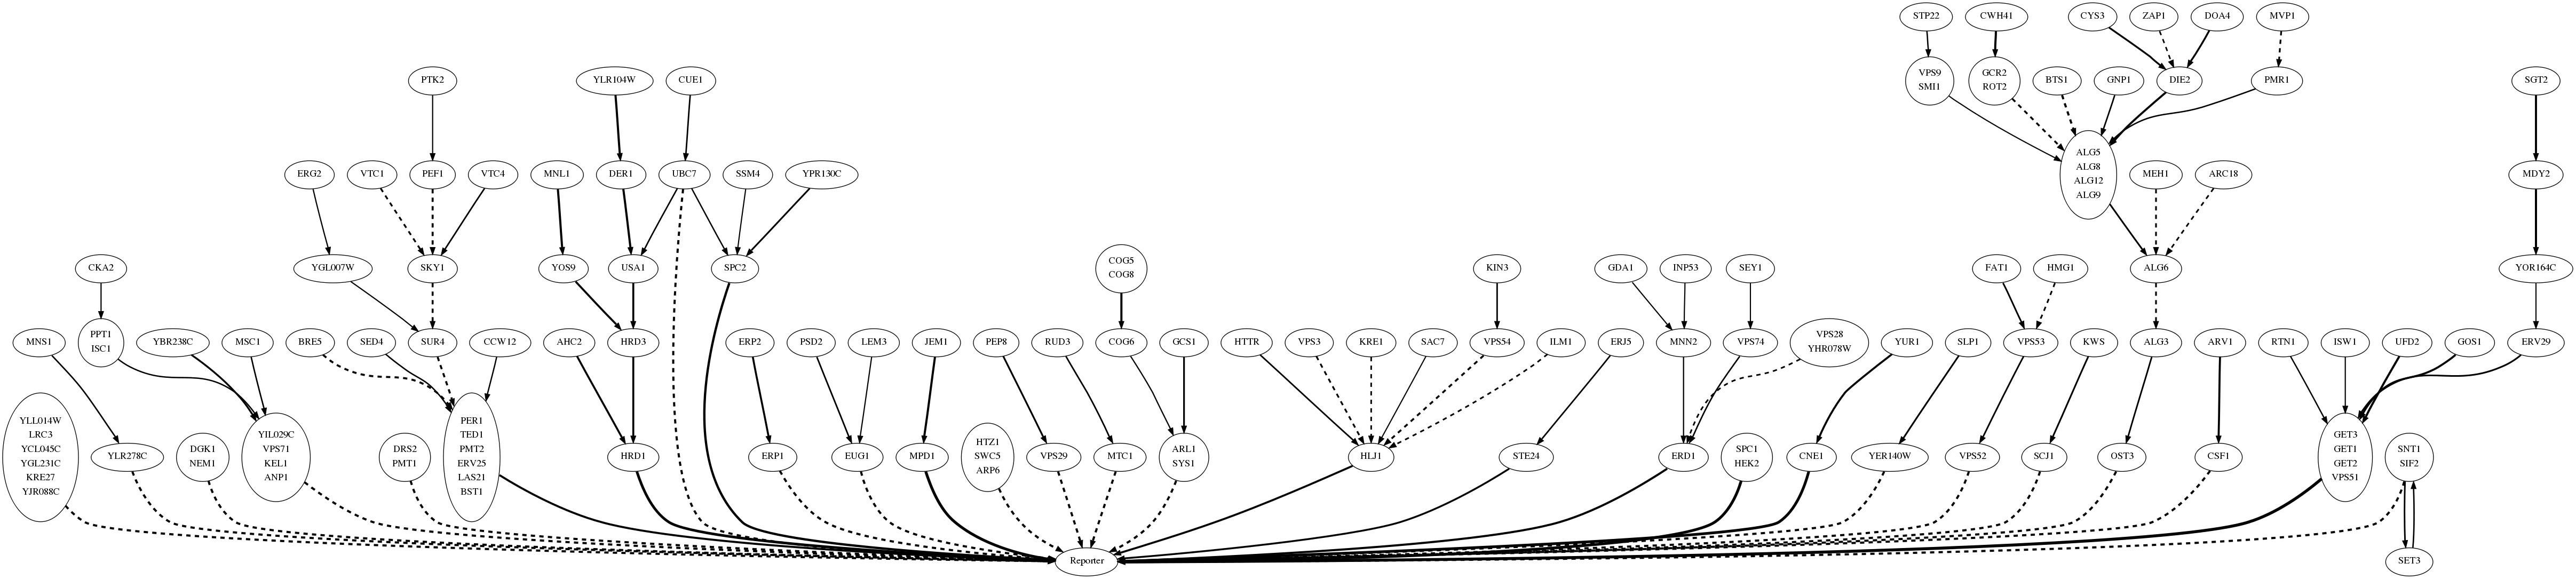
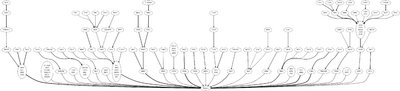
Using the ensemble of APNs learned from the ER dataset, we clustered by graph similarity, providing a visualization of the space of possible network structures. The top level APN below represents the common edges and paths across all samples. The images for the more fine grained clusters then represent the edges and paths common in a subset of the samples. For cytoscape files, please email Alexis at ajbattle@stanford.edu.
- Top level APN visualizationk
- Four APN clusters


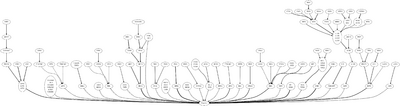
- Twenty APN clusters