|
Supplementary Results |
On this page you will find information and results supplementary to the Typhon paper.
Parameters Used for Testing
Sensitivity Using Consensus Scoring
Sensitivity Using Sum of Pairs Scoring
Database Comparison Using Consensus Scoring
Total Number of Alignments
Seed Extension Comparison
Running Time Comparison
Plots of Predicted Versus Actual Profile Values
Seed Allocation
The general setup for our test results is described in the Typhon paper. Here, we recap the procedure. The database used consisted of a multiple alignment of baboon, cat, chicken, chimp, cow, dog, human, mouse, pig, and rat constructed by LAGAN and refined with MUSCLE. Query species were mouse, fugu, and pig. Mouse was tested on the database with rat removed.
All sensitivity results are measured based on the number of hypothesized homologous annotations (HHAs) identified. HHAs are obtained as follows. For a given query species, we globally align the sequence to the database using LAGAN. Parts of the alignment to which the query aligns without gaps are likely to be true homologies; while this is not always the case we expect it to be a reasonable approximation of the set of homologies present between the database and the query. We therefore mark the positions where each query aligns without gaps as corresponding annotations in the database and the query. We keep those annotations scoring higher than a threshold as HHAs. For tests using consensus scoring, the HHAs are scored using consensus scoring and kept if the score is above 0; for tests using sum-of-pairs scoring, HHAs are scored using sum-of-pairs scoring and kept it the score is above 0.
We tested Typhon versus STANDARD on three query species for varying values of B. Only ungapped alignments were used, as when gapped alignments are used, each gapped alignment can identify a variable number of HHAs, which complicated assessment of the seeding method. We used patterns of weight 10 and span 18 as well as patterns of weight 11 and span 19; these choices for pattern weights are based on the tests presented in past research on spaced seeds. To handle low complexity regions and repeats, we pre-processed the query using DUST (Tatusov, R.L. and Lipman, D.J, unpublished) and discarded from the index those k-mers occurring more frequently than 5 standard deviations above the mean. We chose this value because we found that it significantly speeds up searches with no loss in sensitivity. We used a candidate set of 15 patterns for Typhon and designed the set of seeds using Mandala's greedy covering algorithm. When partitioning the profile into a set of region classes, Typhon used R = 40.
All scoring was done using the HOXD scoring matrix, which is the default matrix in BLASTZ. We chose permissive scoring thresholds to allow each algorithm to identify potentially low-scoring HHAs; we were more concerned with the ability of seeds to match HHAs than whether an alignment algorithm accepts them. For mouse, alignments scoring greater than 2890 were kept with consensus scoring and 8540 with sum of pairs scoring. For fugu, alignments scoring greater than 2300 were kept with consensus scoring and 12850 with sum of pairs scoring. For pig, alignments scoring greater than 2880 were kept with consensus scoring and 8540 with sum of pairs scoring. These thresholds for consensus scoring were selected somewhat heuristically; we chose values that did eliminate many HHAs but did not return an overwhelming number of alignments. We chose thresholds for sum-of-pairs scoring such that the number of alignments returned under each scoring system was roughly the same.
These graphs compare the sensitivity of Typhon to that of a standard BLAST-like aligner. For a complete description of these tests, see the Typhon paper. For STANDARD and Typhon the number of HHAs overlapped by an alignment is plotted as a function of the average number of seeds indexed at each position. We tested seed weights of 10 and 11. HHAs were generated as described above by eliminating corresponding annotations with consensus scores below 0. There were in total 10801 HHAs that could potentially be identified for mouse, 852 for fugu, and 11873 for pig. There were 116 exons that could be identified for fugu. For a complete discussion of these results, see the Typhon paper.
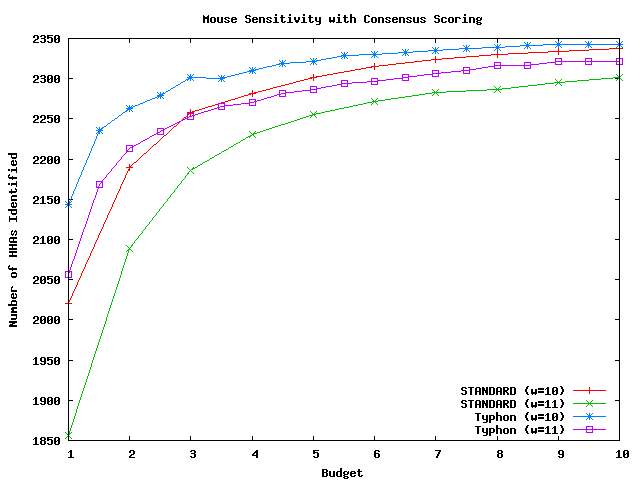
Above plot shows the number of HHAs identified for mouse.
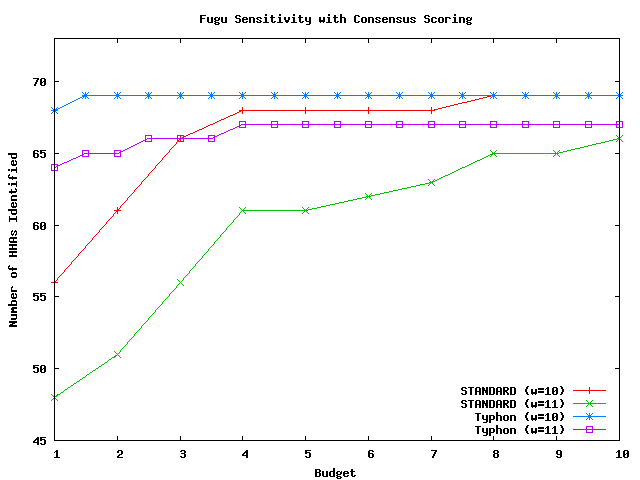
Above plot shows the number of HHAs identified for fugu.
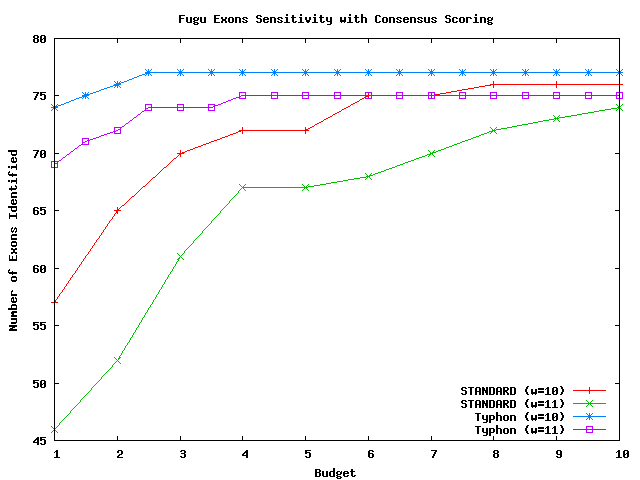
Above plot shows the number of exons identified for fugu.
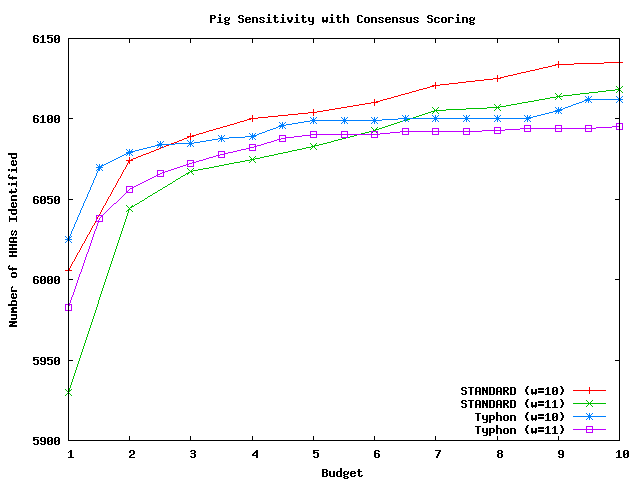
Above plot shows the number of HHAs identified for pig.
These graphs compare the sensitivity of Typhon to that of a standard BLAST-like aligner; each used sum of pairs scoring and indexed the same multiple alignment. The methodology is identical to that used by the tests above but with sum of pairs scoring replacing consensus scoring. There were in total 10626 HHAs that could potentially be identified for mouse, 546 for fugu, and 12358 for pig. For a complete discussion of these tests, see the Typhon paper.
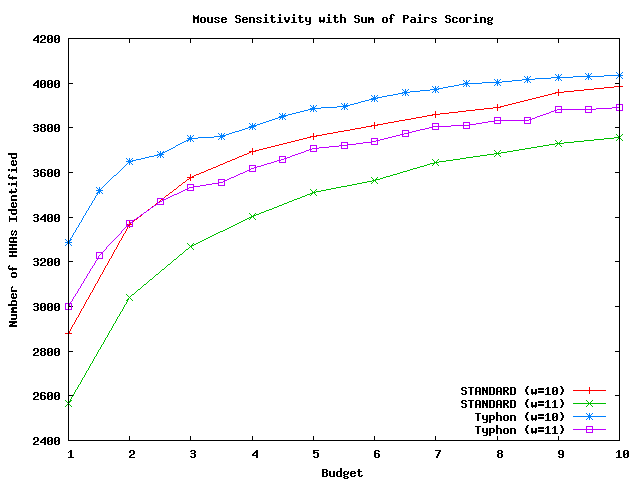
Above plot shows the number of HHAs identified for mouse.
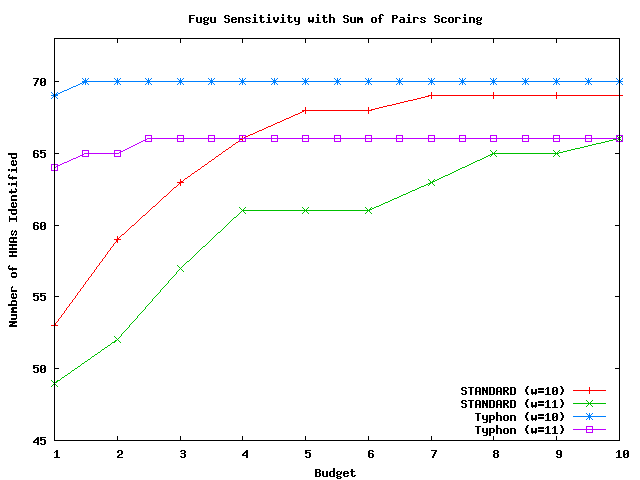
Above plot shows the number of HHAs identified for fugu.

Above plot shows the number of exons identified for fugu.
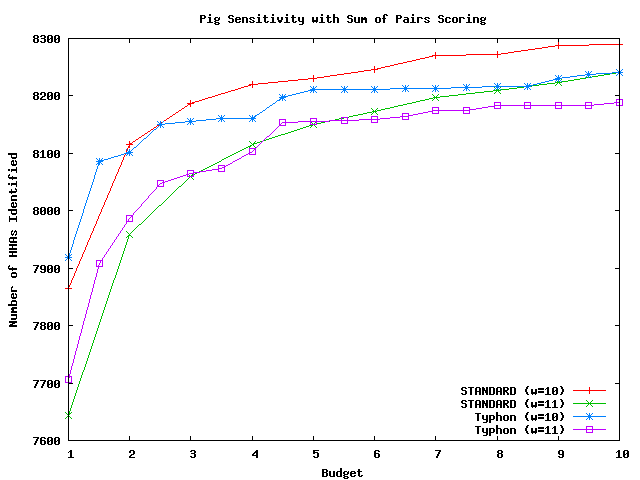
Above plot shows the number of HHAs identified for pig.
These graphs compare the sensitivity that results from using different databases. The databases compared were the closest species in the alignment to the query and the alignment projected to remove columns gapped in the closest species. All algorithms used consensus scoring. The testing methodology was the same as that used for tests comparing sensitivity results on the full alignment. There were in total 10678 HHAs that could potentially be identified for mouse, 848 for fugu, and 11094 for pig. For a complete discussion of these tests, see the Typhon paper.
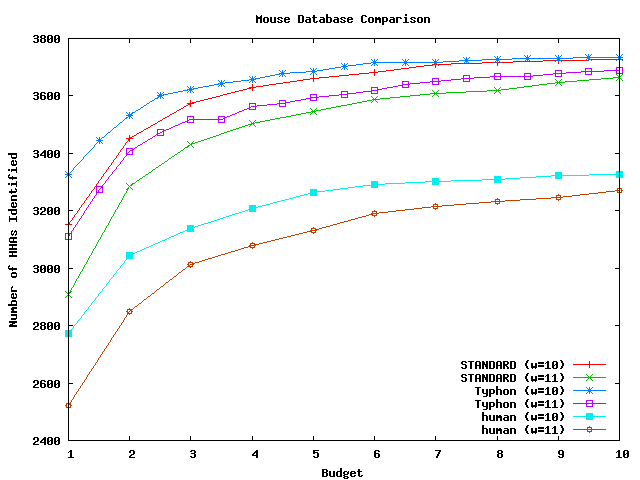
Above plot shows the number of HHAs identified for mouse.

Above plot shows the number of HHAs identified for fugu.
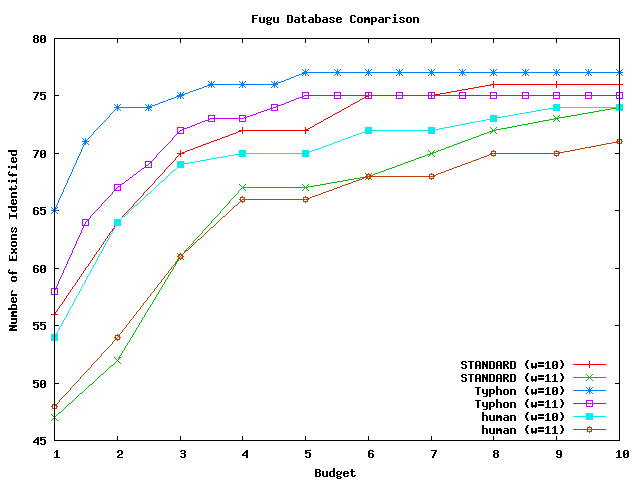
Above plot shows the number of exons identified for fugu.
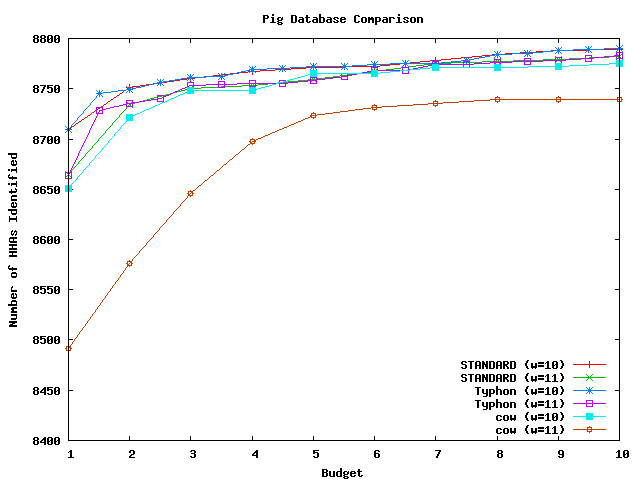
Above plot shows the number of HHAs identified for pig.
Shown here is a comparison of the total number of alignments returned by various algorithms.
The above plot shows the number of alignments returned by Typhon and STANDARD on the full alignment database using mouse as a query with consensus scoring.
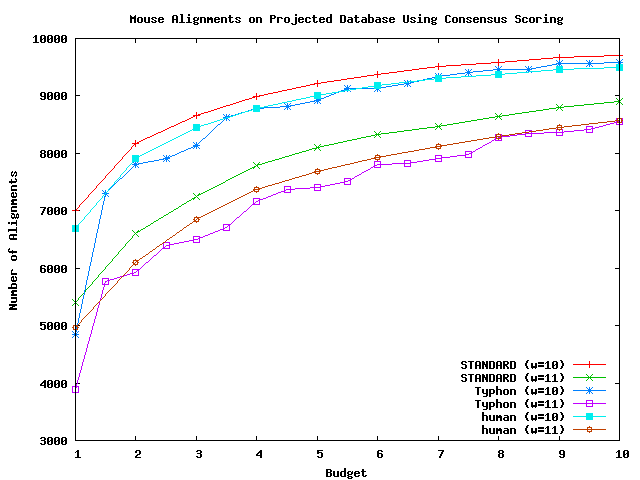
The above plot shows the number of alignments returned by Typhon and STANDARD on the full alignment database using mouse as a query with consensus scoring, as well the number of alignments returned by STANDARD using human as a database.
As can be seen by the above plots, the number of alignments are roughly equal. Typhon finds slightly fewer alignments, but many of the alignments found by STANDARD are questionable. Upon examination, many have gaps in many species in the alignment.
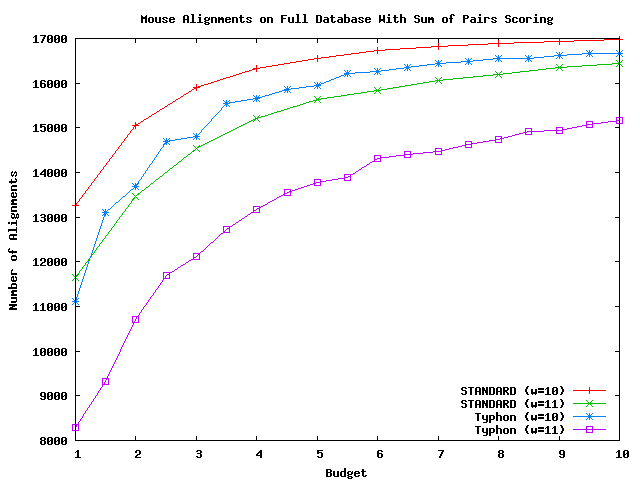
To test that most alignments returned by STANDARD are potentially non-homologous, we compared the number of alignments returned by Typhon and STANDARD using sum of pairs scoring, which should penalize alignments with many gaps. The below plot shows such results on the full alignment database using mouse as a query; as expected Typhon returns many more alignments.

These graphs compare the number of seed extensions performed by STANDARD and Typhon.
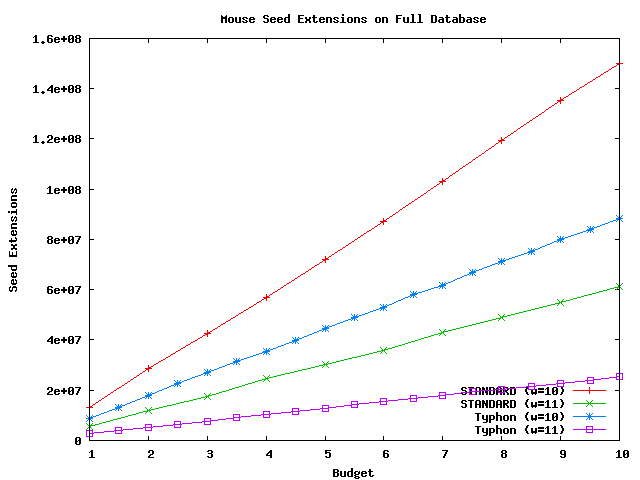
Above plot shows the number of extensions performed using mouse as a query sequence and the full alignment as the database.

Above plot shows the number of extensions performed using fugu as a query sequence and the full alignment as the database.
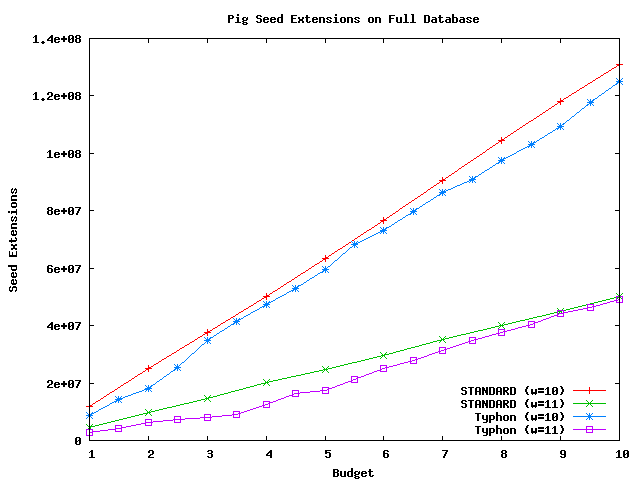
Above plot shows the number of extensions performed using pig as a query sequence and the full alignment as the database.

Above plot shows the number of extensions performed using mouse as a query sequence and the full alignment as the database.
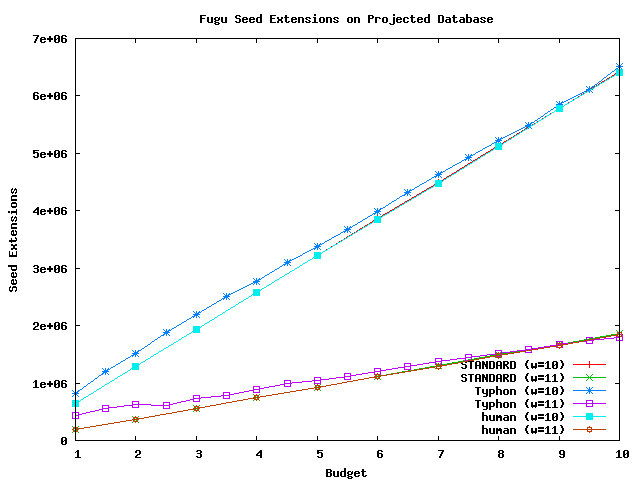
Above plot shows the number of extensions performed using fugu as a query sequence and the projected alignment as the database.
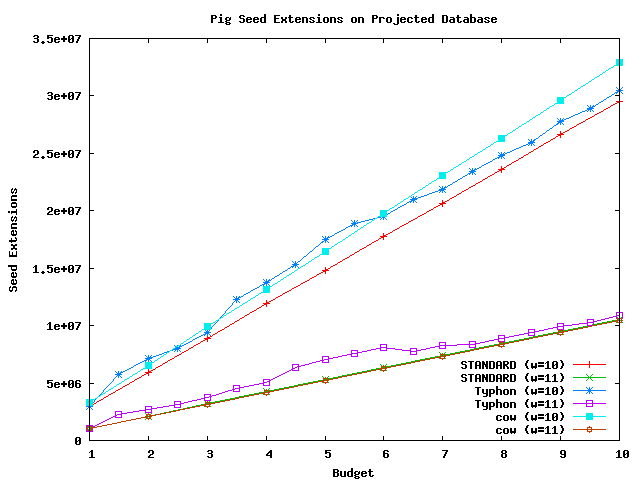
Above plot shows the number of extensions performed using pig as a query sequence and the projected alignment as the database.
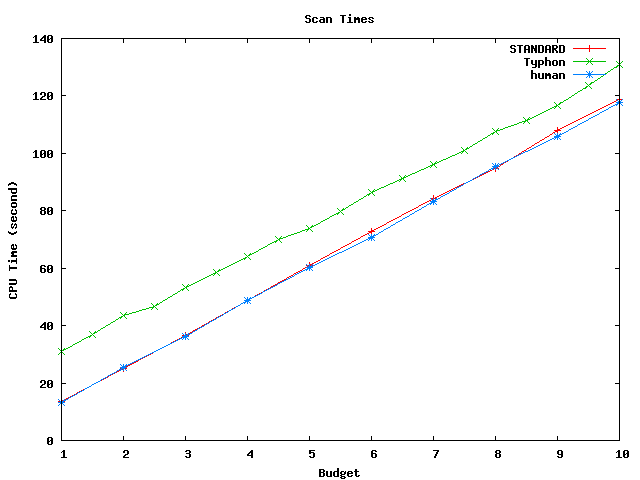
These graphs compare the times spent building and scanning the index for the full database as well as the projected database.
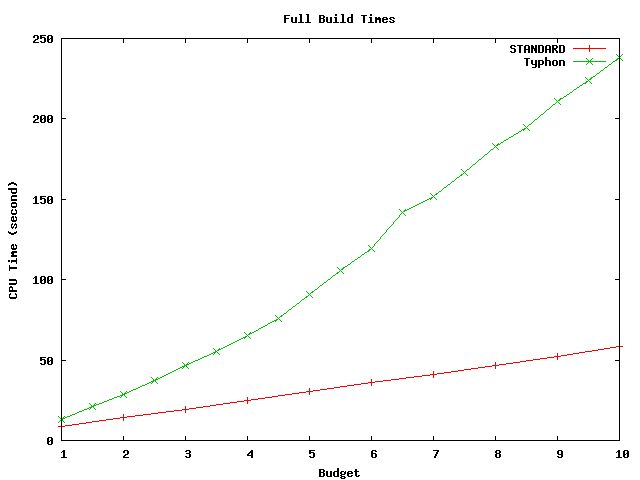
Above plot shows build times for the full alignment database. This database has size of about 4.2 Mbp.
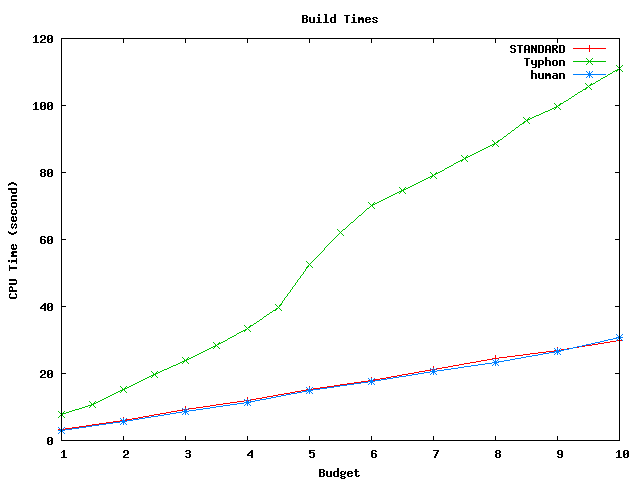
Above plot shows build times for the projected alignment database. This database has size of about 1.8 Mbp.
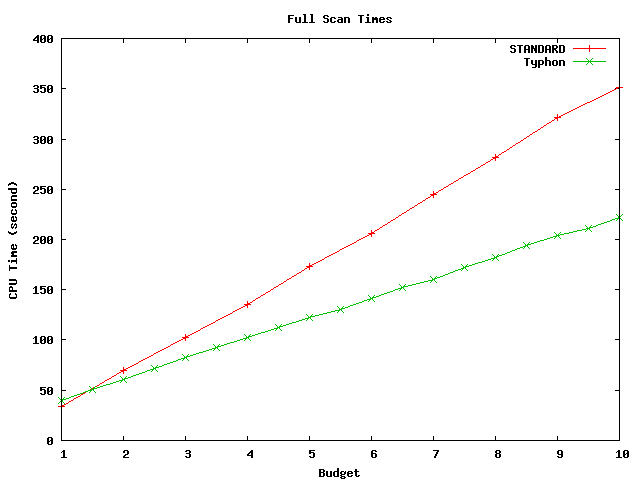
Above plot shows scan times for the full alignment database. This database has size of about 4.2 Mbp.
Above plot shows scan times for the projected alignment database. This database has size of about 1.8 Mbp.
As described in the text, we plotted predicted versus actual values of similarity levels and the probability of a species being ungapped in an alignment. If predicted values were correct, plots would permit a linear fit. We show below plots of only a few species, but results for other species are similar.
Plots of the probability of a species being ungapped did not appear to obey a pattern at a first glance. Below, we show plots for several species. The linear curve plotted is not a fitting; it merely shows our predictions. The plots have a high variance and therefore do not justify modifying our predictions. They do not necessarily justify that the predictions are accurate, but they do hint that there is no obvious improvement to be made. Typhon should only improve with better predictions for this value.
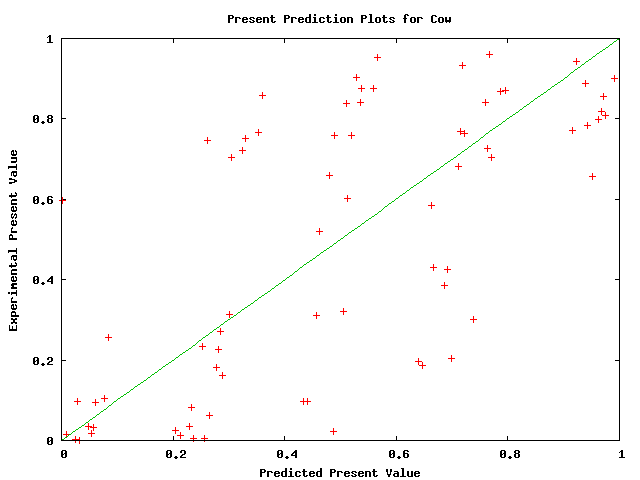
Above plot shows predicted versus actual values of probability of cow being ungapped in a alignment.
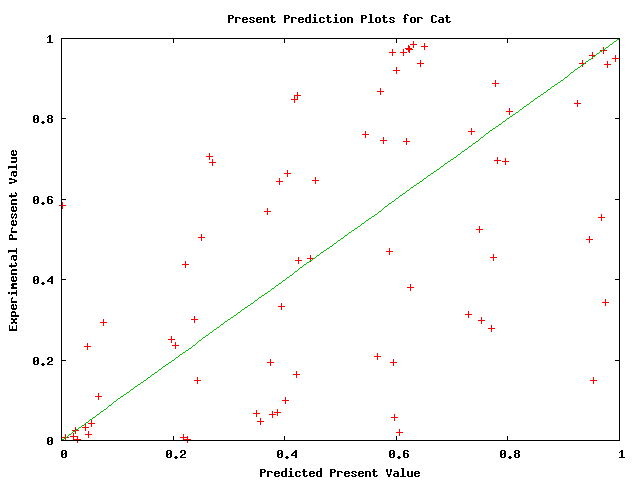
Above plot shows predicted versus actual values of probability of cat being ungapped in a alignment.
Plots of the similarity level have less variance and appear to fit an exponential relationship. They are shown below
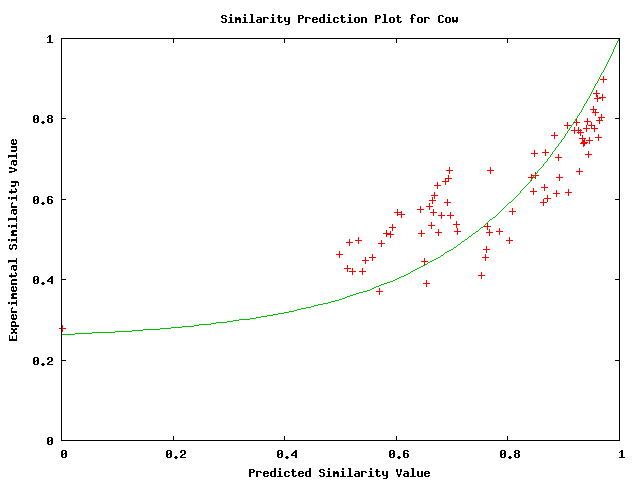
Above plot shows predicted versus actual values of probability of similarity level between cow and the alignment.
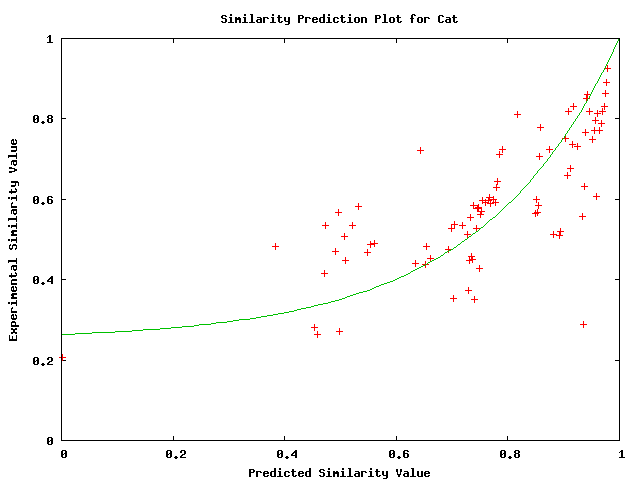
Above plot shows predicted versus actual values of probability of similarity level between cat and the alignment.
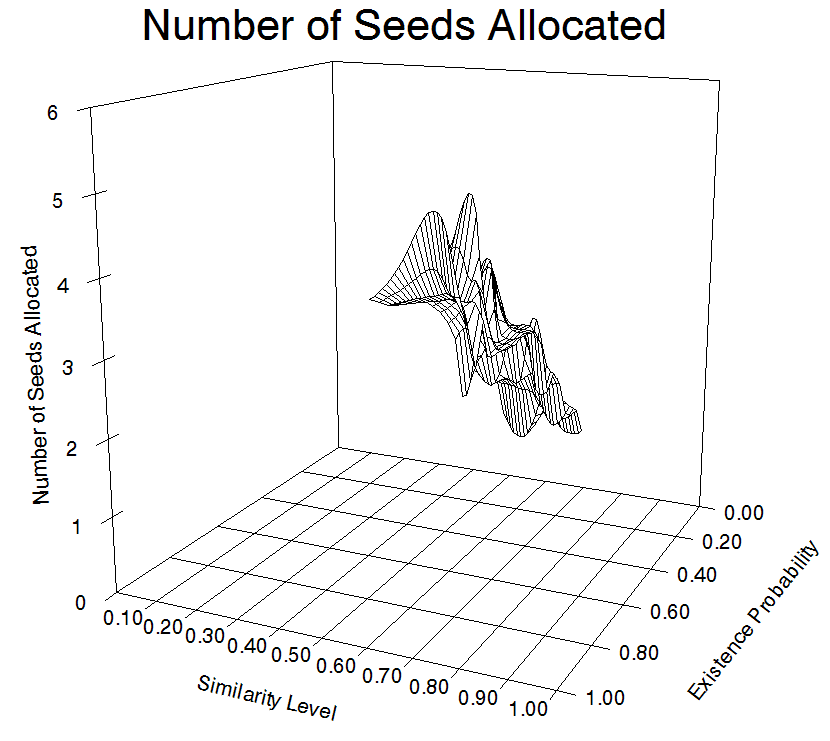
Here we show a plot that shows the number of seeds allocated to each region class. The below plot shows p_present and p_id on the x and y axes and the z axis shows the number of seeds allocated to each region class. While it is somewhat difficult to see, we see that the predominant factor is p_present, and the influences of p_id are secondary. This plot was generated using mouse as a query on the full database with a budget of 2.
©2005 Jason Flannick and Serafim Batzoglou