


Next: Bibliography
Up: suppl_html
Previous: Redundancy in simultaneously recorded
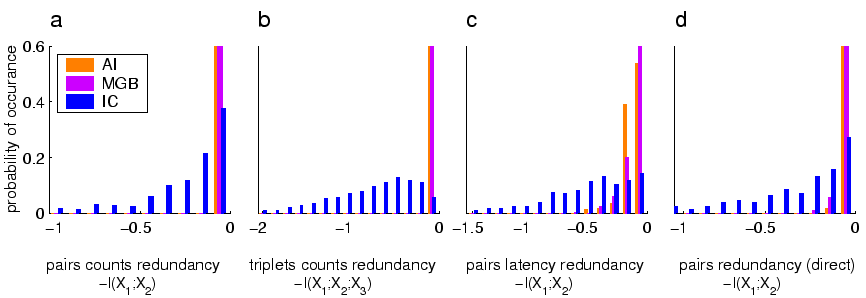
Figure:
S2. Comparison of un-normalized redundancies in different brain
regions. The panels show redundancy calculated using (a) distribution
of spike counts (b) spike counts in triplets of cells (c) distribution
of first spike latencies (d) the direct method (Spike patterns as
binary words). The non-normalized redundancy measures yield larger
differences between IC and MGB/A1, presumably because of the higher
level of single-unit MI in IC relative to MGB and A1.
 |
Normalization of the redundancy measure is required to correct for the
effect of single-unit information on pairs redundancy. Different brain
areas have different single cell information levels, which impose
different limits on the pairwise redundancy in the different brain
areas and therefore requires this normalization.
To demonstrate that the normalization does not strengthen the effects
we observed but actually weaken it, Fig. S2 compares un-normalized
redundancies, which exhibit a much stronger difference between IC and
AI/MGB.
Gal Chechik
2006-07-19