ALL AML Leukemia (examples.aml_all)
This module demonstrates the ability of NMF to recover meaningful biological information from cancer related microarray data. NMF appears to have advantages over other methods such as HC or SOM. Instead of separating gene clusters based on distance computation, NMF detects context-dependent patterns of gene expression in complex biological systems.
Leukemia data set is used in this example. This data set is a benchmark in the cancer classification community. It contains two ALL samples that are consistently misclassified or classified with low confidence by most methods. There are a number of possible explanations for this, including incorrect diagnosis of the samples. They are included them in example.The distinction between AML and ALL, as well as the division of ALL into T and B cell subtypes is well known.
Note
Leukemia data set used in this example is included in the datasets and does not need to be
downloaded. However, download links are listed in the datasets. To run the example, the data set
must exist in the ALL_AML directory under data sets.
This example is inspired by [Brunet2004]. In [Brunet2004] authors applied NMF to the leukemia data set. With rank, rank = 2, NMF recovered the AML-ALL biological distinction with high accuracy and robustness. Higher ranks revealed further partitioning of the samples. Clear block diagonal patterns in reordered consensus matrices attest to the robustness of models with 2, 3 and 4 classes.
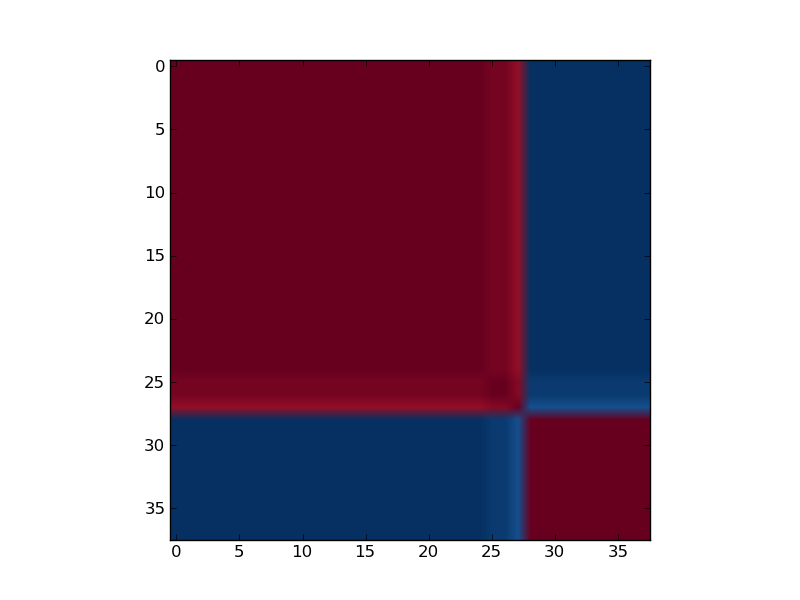
Reordered consensus matrix generated for rank, rank = 2. Reordered consensus matrix averages 50 connectivity matrices computed at rank = 2, 3 for the leukemia data set with the 5000 most highly varying genes according to their coefficient of variation. Samples are hierarchically clustered by using distances derived from consensus clustering matrix entries, coloured from 0 (deep blue, samples are never in the same cluster) to 1 (dark red, samples are always in the same cluster).
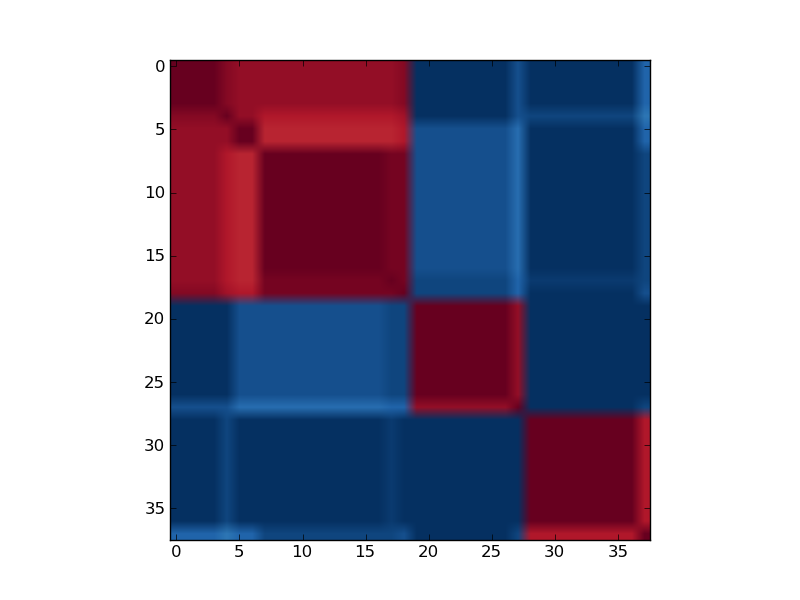
Reordered consensus matrix generated for rank, rank = 3.
| Sample | rank = 2 | rank = 3 |
|---|---|---|
| ALL_19769_B-cell | 0 | 2 |
| ALL_23953_B-cell | 0 | 2 |
| ALL_28373_B-cell | 0 | 2 |
| ALL_9335_B-cell | 0 | 2 |
| ALL_9692_B-cell | 0 | 2 |
| ALL_14749_B-cell | 0 | 2 |
| ALL_17281_B-cell | 0 | 2 |
| ALL_19183_B-cell | 0 | 2 |
| ALL_20414_B-cell | 0 | 2 |
| ALL_21302_B-cell | 0 | 1 |
| ALL_549_B-cell | 0 | 2 |
| ALL_17929_B-cell | 0 | 2 |
| ALL_20185_B-cell | 0 | 2 |
| ALL_11103_B-cell | 0 | 2 |
| ALL_18239_B-cell | 0 | 2 |
| ALL_5982_B-cell | 0 | 2 |
| ALL_7092_B-cell | 0 | 2 |
| ALL_R11_B-cell | 0 | 2 |
| ALL_R23_B-cell | 0 | 2 |
| ALL_16415_T-cell | 0 | 1 |
| ALL_19881_T-cell | 0 | 1 |
| ALL_9186_T-cell | 0 | 1 |
| ALL_9723_T-cell | 0 | 1 |
| ALL_17269_T-cell | 0 | 1 |
| ALL_14402_T-cell | 0 | 1 |
| ALL_17638_T-cell | 0 | 1 |
| ALL_22474_T-cell | 0 | 1 |
| AML_12 | 1 | 0 |
| AML_13 | 0 | 0 |
| AML_14 | 1 | 1 |
| AML_16 | 1 | 0 |
| AML_20 | 1 | 0 |
| AML_1 | 1 | 0 |
| AML_2 | 1 | 0 |
| AML_3 | 1 | 0 |
| AML_5 | 1 | 0 |
| AML_6 | 1 | 0 |
| AML_7 | 1 | 0 |
To run the example simply type:
python all_aml.py
or call the module’s function:
import nimfa.examples
nimfa.examples.all_aml.run()
Note
This example uses matplotlib library for producing a heatmap of a consensus matrix.
-
nimfa.examples.all_aml.plot(C, rank)¶ Plot reordered consensus matrix.
Parameters: - C (numpy.ndarray`) – Reordered consensus matrix.
- rank (int) – Factorization rank.
-
nimfa.examples.all_aml.read()¶ Read ALL AML gene expression data. The matrix’s shape is 5000 (genes) x 38 (samples). It contains only positive data.
Return the gene expression data matrix.
-
nimfa.examples.all_aml.reorder(C)¶ Reorder consensus matrix.
Parameters: C (numpy.ndarray) – Consensus matrix.
-
nimfa.examples.all_aml.run()¶ Run Standard NMF on leukemia data set.
-
nimfa.examples.all_aml.run_one(V, rank)¶ Run standard NMF on leukemia data set. 50 runs of Standard NMF are performed and obtained consensus matrix averages all 50 connectivity matrices.
Parameters: - V (numpy.ndarray) – Target matrix with gene expression data.
- rank (int) – Factorization rank.
