

Our goal is to design a flow model similar to the human cardiovascular system so that it can be used for cardiovascular device testing and physician training.
The key scientific areas relevant to our project include:
Figure 3: Human heart with the aorta
Cardiovascular flow modeling
The fluid dynamics of the cardiovascular system are extremely complex. Modeling it requires tools ranging from simple lumped parameters to sophisticated numerical techniques. Lumped parameter models based on an electrical circuit analogy provide a computationally simple way to obtain information about the overall behavior of the cardiovascular system. In these models, electric potential and current are analogous to the average pressure and flow rate, respectively. A particular vessel (or group of vessels) is described by means of its impedance, which is represented by an appropriate combination of resistors, capacitors and inductors. The resistors are used to model viscous dissipation, while the capacitors account for vessel compliance; the ability to accumulate and release blood due to elastic deformation. Finally, the inductors are used to model inertia terms. Regions of the vascular system can then be modeled and linked in a circuit network. These relationships are used to develop a set of nonlinear ordinary differential equations. As an example, the total resistance through a blood vessel can be computed by drawing an analogy between blood flow through an artery and current through a resistor.
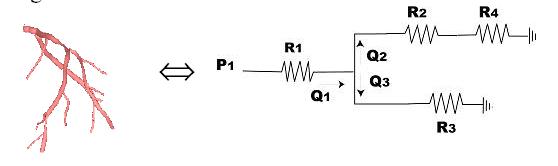
Figure 4: Analogy between blood flow through an artery and current flow through a resistor
If p is the pressure, Q is the flow rate through the vascular system, then the pressure drop and flow rate can related by:
Dp = QR Û V =IR (Ohms Law)
Vessel compliance can also be modeled using a similar electrical circuit analogy. Consider the flow of blood into a compliant vessel.
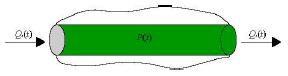
Figure 5: Flow of
blood into a compliant vessel (
If Q1 is the input flow and Q2 is the output flow, assuming a linear relationship, we have DQ = Q1 Q2 = C dp/dt , where C is the compliance of the vessel. This is analogous to the governing equation of a capacitor, I = C dV/dt, where I is current and V is voltage.
Similarly an arterial tree can be modeled using the following RCR circuit:
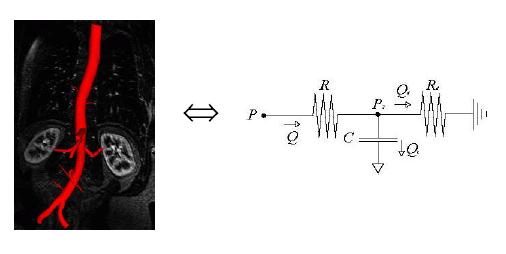
Figure 6: RCR circuit
analogy for an arterial tree (
Using the above analogies to electrical circuits, pressure and flow rates at critical points inside the arteries can be computed using elementary circuit analysis.
For the testing and validation of our artificial cardiovascular flow model the team used the chart shown in Figure 7. It depicts the arterial pressures and flow rates through critical sections of the human aorta (McDonald, 1974).
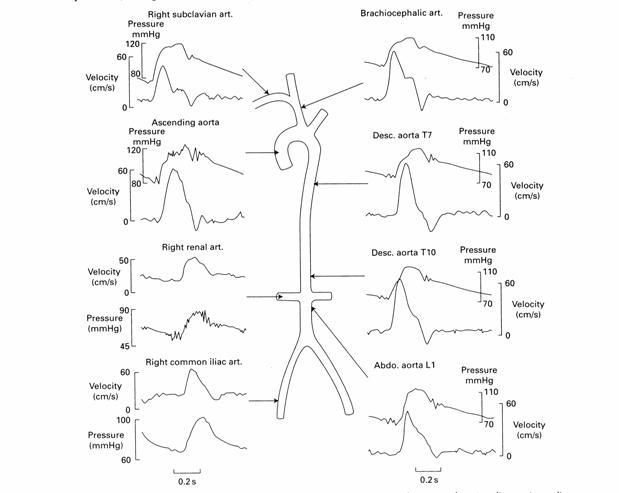
Figure 7: Target Values for Aortic Pressure and Flow Velocity
In our final prototype we aim to produce arterial pressures and flow rates within 10% of these published values. The exact shape of the waveform is not a critical feature of the Guidant model but physiologic realism is the ultimate project goal. Figure 7 shows a schematic of the target pressures and flow rates throughout the arterial model.
Heart Wall Motion
The heart prototype should also exhibit biphasic wall motion similar to a human heart. The human heart has four chambers; two atria and two larger ventricles. The biphasic motion results when the atria contract pushing blood into the ventricles, and thus expanding the ventricles. In our heart prototype we have combined the two atrium chambers into one common atrium cavity. Similarly, the two ventricles have been modeled as one cavity.
The coronary arteries sit on the heart as shown in Figure 8 and move with the heart walls. Our heart prototype should produce wall motion (biphasic contraction and expansion of the atrium and ventricle) such that the coronary arteries displace realistically.
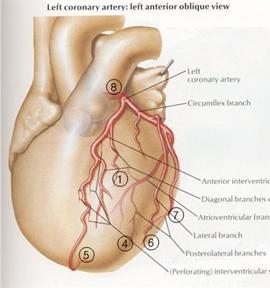
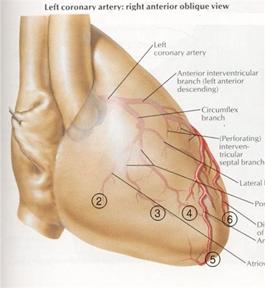
Figure 8: Coronary arteries attached to the heart wall
Figure 9 shows the 3-D images of the coronary arteries in systole (when the ventricles contract) and diastole (when the ventricles expand) created from an angiogram.
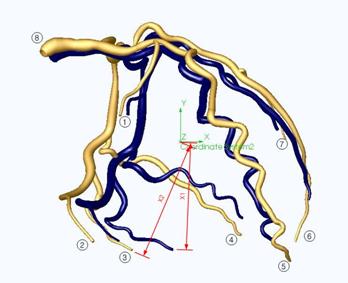
Figure 9: 3-D solid model of the coronary arteries. Blue vessels indicate position during end systolic contraction. Gold vessels indicate position during end diastolic expansion.
From the model we determined the percent displacements of some selected points (points 1-8 as shown in Figure 9) of the coronary arteries. Points 1,2,3,4 and 7 lie on the ventricle side-walls and displace due to the ventricle side-wall expansion. We used the average of the displacement values of these points as the parameter for the amount of ventricle side-wall expansion. Points 5 and 6 are near the tip of the ventricle. The average of the displacement values of these points was used as the parameter for the ventricle elongation. Lastly, the displacement value for the point 8 was used to approximate atrium expansion. The percent displacement values for selected points on the coronary arteries form the basis for the validation of the realism of our prototype heart wall motion.
Elementary plane stress analysis is useful for heart wall design and blood flow modeling. For example, a heart can be modeled as a spherical pressure vessel with radius r and wall thickness t subjected to an internal gage pressure p.
Figure 10: Pressurized spherical vessel (Pressure Vessel)
The stress around the heart wall must have a net resultant to balance the internal pressure across the cross-section. Therefore, the stress and the internal pressure can be related as:
s t 2 P r = p P r2
Þ s = p r / 2 t
Similarly a blood vessel can be modeled as a cylindrical pressure vessel with radius r and wall thickness t subjected to an internal gage pressure p.
Figure 11: A pressurized cylindrical vessel (Pressure Vessel)
According
to
2 sh t dx = p 2 r dx
Þ sh = p r / t
Fluoro-compatibility
The arterial model will be viewed under a fluoroscope during the testing of cardiovascular devices. Fluoroscopy is a means of visualizing moving body structures, similar to an x-ray "movie." During fluoroscopic examination a continuous x-ray beam is passed through the object of interest and is transmitted to a monitor to be viewed in real time. In cardiac catheterization, fluoroscopy enables the physician to see the flow of blood injected with a contrast agent through the coronary arteries in order to examine the presence of arterial blockages. During intravenous catheter insertion, fluoroscopy assists the physician in guiding the catheter into a specific location inside the body.