

The goal of our project is to incorporate new design features into the existing Guidant SAM to improve the clinical realism of the model. It is of critical importance to Guidant that the model includes the following:
· Pulsatile flow through the vasculature
· Realistic flow rate and pressure in the major arteries
· Heart wall motion
· Synchronization of the heart beat and the pulsatile flow
The pulsatile flow will be produced by a Harvard Apparatus pump. Both the stroke rate and volume of the Harvard pump can be adjusted to simulate realistic cardiac output. The team seeks to produce arterial pressures and flow rates within 10% of published values taken from Blood Flow in Arteries (McDonald, 1974). The pressure and velocity waveforms in the major arteries are shown in the diagram below.
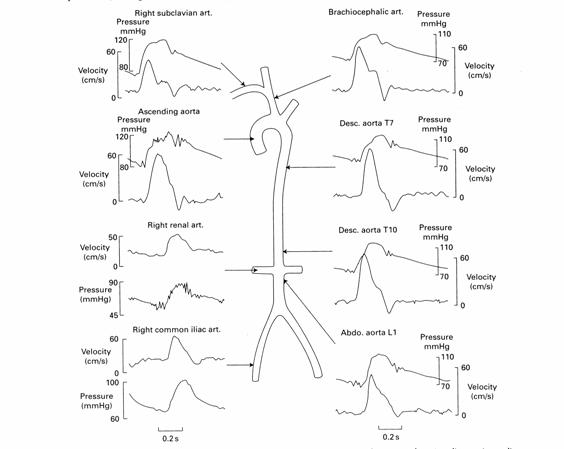
Figure 12: Target Values for Aortic Pressure and Flow Velocity
The exact shape of the waveform is not a critical feature of the Guidant model but physiologic realism is the ultimate project goal. The project sponsors are interested in design recommendations regarding the use of capacitance elements exterior to the model that are necessary to produce an accurate waveform but it is not an express design requirement.
The design requirements regarding heart wall motion are more subjective. The goal of realism requires that the beating heart display life-like biphasic motion. Since it is only the coronary arteries that can be visualized with contrast under fluoroscopy, the beating of the heart must produce realistic displacement of the coronary arteries. To validate this design requirement, the team will use visual comparison to angiogram movies and spline models of the beating heart. The team has also acquired 3-D images of the coronary arteries in systole and diastole created from an angiogram, shown in Figure 13.
The 3D images were loaded into SolidWorks and a quantitative analysis was done to determine the displacement of the vessels. The origins of the two images seen below were first superimposed in an assembly file. A new origin was placed at the approximate centroid of the heart to determine the percentage the heart wall had expanded. By measuring the magnitude of a vector from the origin to the end of each vessel, in both systole and diastole, it is possible to extract the percentage that artery has moved. This is seen in Figure 13. By mapping each of the eight points onto a rendering of the coronary arteries on the heart, we can correlate the motion of each artery with a section of the heart as seen in Figure 14.
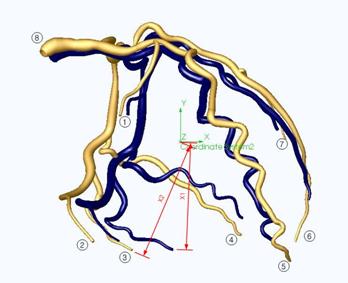
Figure 13: 3D solid model of left coronary arteries. Blue vessels indicate position during end systolic contraction. Gold vessels indicate position during end diastolic expansion.
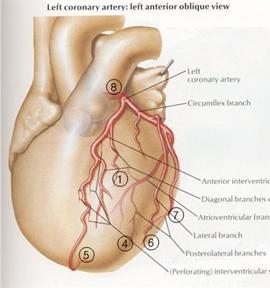
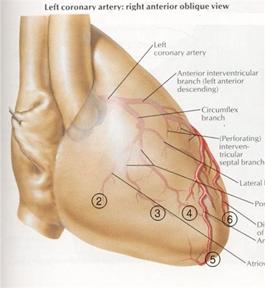
Figure 14: Mapping of coronary arteries from solid model onto anatomically correct illustration of the human heart. Numbers correspond to vessel end points in solid model.
Table 1: Data from 3D solid model representing the displacement of the vessels during diastole